Are you curious about how Eli Lilly’s financial performance stacks up this quarter?
In Q2 FY24, Eli Lilly has shown significant growth, with total revenue reaching $8.31 billion, a remarkable 15% increase from the same period last year.
What does this mean for stakeholders and investors?
This article delves into the details behind these numbers, examining key products driving revenue, cost management measures, and projections for the full-year financial outlook.
If you want to understand Eli Lilly’s financial health and future potential, keep reading for an in-depth analysis.
Eli Lilly Q2 FY24 Revenue Overview
Eli Lilly reported a total revenue of $8.31 billion for Q2 FY24, marking a 15% increase from Q2 FY23. This substantial growth is primarily due to a 10% increase in sales volume and a 5% rise in pricing. The company's strategic initiatives and market positioning have contributed significantly to this upward trajectory.
Year-over-year revenue growth has been robust, propelled by the strong performance of key products like Trulicity and Jardiance. These products have shown remarkable sales figures, reinforcing Eli Lilly's dominant position in the pharmaceutical market. The company's ability to innovate and deliver effective treatments has been pivotal in driving these numbers.
| Product | Revenue | Percentage of Total Revenue |
|---|---|---|
| Trulicity | $1.25 billion | 15% |
| Jardiance | $0.77 billion | 9% |
| Verzenio | $1.33 billion | 16% |
| Taltz | $0.82 billion | 10% |
| Mounjaro | $3.09 billion | 37% |
Looking forward, Eli Lilly has provided full-year 2024 revenue guidance, expecting to achieve between $32 billion and $33 billion. This optimistic outlook is backed by the company's strong product portfolio and ongoing innovations, which are anticipated to sustain and potentially accelerate the growth momentum observed in Q2 FY24.
Cost of Goods Sold and Gross Profit Analysis for Q2 FY24
Eli Lilly's cost of goods sold (COGS) for Q2 FY24 was reported at $2.45 billion. This figure represents the direct costs tied to the production of the pharmaceuticals sold during the quarter. Effective cost management has been crucial in maintaining a favorable balance between production expenses and revenue. By keeping COGS under control, Eli Lilly has been able to sustain its profitability while ensuring high-quality product output.
The gross profit for Q2 FY24 stood at $5.86 billion, showcasing a significant rise from $5.02 billion in Q2 FY23. This increase highlights Eli Lilly's success in enhancing its profit margins. The company’s ability to generate higher revenue while managing production costs efficiently has been a key driver in this growth. The improved gross profit indicates a robust financial performance and a well-executed strategy in cost management.
Key Cost Control Measures:
- Enhanced supply chain efficiencies: Streamlined processes to reduce production delays and costs.
- Strategic sourcing: Negotiated better terms with suppliers to lower raw material costs.
- Operational automation: Invested in technology to automate repetitive tasks, reducing labor costs.
- Lean manufacturing practices: Implemented lean principles to minimize waste and improve productivity.
- Energy management: Adopted energy-saving initiatives to lower utility expenses.
Operating Expenses Breakdown for Q2 FY24
Eli Lilly's total operating expenses for Q2 FY24 amounted to $3.12 billion. This figure encompasses all costs associated with running the company's operations, including research and development (R&D), selling, general, and administrative (SG&A) expenses. The careful monitoring and management of these expenses have been crucial in maintaining the company's financial health and operational efficiency.
When breaking down the operating expenses, research and development costs were the largest component, totaling $2.71 billion. This significant investment underscores Eli Lilly's commitment to innovation and developing new treatments. Additionally, selling, general, and administrative expenses were reported at $2.12 billion. These costs cover a range of activities, from marketing and sales efforts to administrative functions necessary for the company's daily operations.
Year-over-year, Eli Lilly's operating expenses saw an increase from $3.00 billion in Q2 FY23 to $3.12 billion in Q2 FY24. Despite this increase, there has been a notable reduction in operating expenses as a percentage of revenue. This indicates that the company has been successful in scaling its operations efficiently, generating higher revenues without a proportional increase in operating costs.
Main Categories of Operating Expenses:
- Research and Development (R&D)
- Selling, General, and Administrative (SG&A)
- Marketing and Sales
- Administrative Functions
Net Income and Earnings Per Share for Q2 FY24
Eli Lilly reported a net income of $1.94 billion for Q2 FY24. This represents a notable increase from the $1.67 billion reported in Q2 FY23. The company's strong financial performance in this quarter underscores its ability to effectively manage resources and capitalize on market opportunities. The growth in net income is a clear indicator of Eli Lilly's robust business strategies and successful product portfolio.
Earnings per share (EPS) for Q2 FY24 came in at $2.14, up from $1.85 in Q2 FY23. This increase in EPS reflects the company's improved profitability and efficient cost management. Investors can take confidence in Eli Lilly's financial health, as the company has also provided full-year EPS guidance, expecting to achieve between $8.50 and $8.70. This optimistic outlook is supported by the company's ongoing innovations and market expansion efforts.
| Metric | Q2 FY24 | Q2 FY23 |
|---|---|---|
| Net Income | $1.94 billion | $1.67 billion |
| Earnings Per Share (EPS) | $2.14 | $1.85 |
Revenue Breakdown by Product Line in Q2 FY24
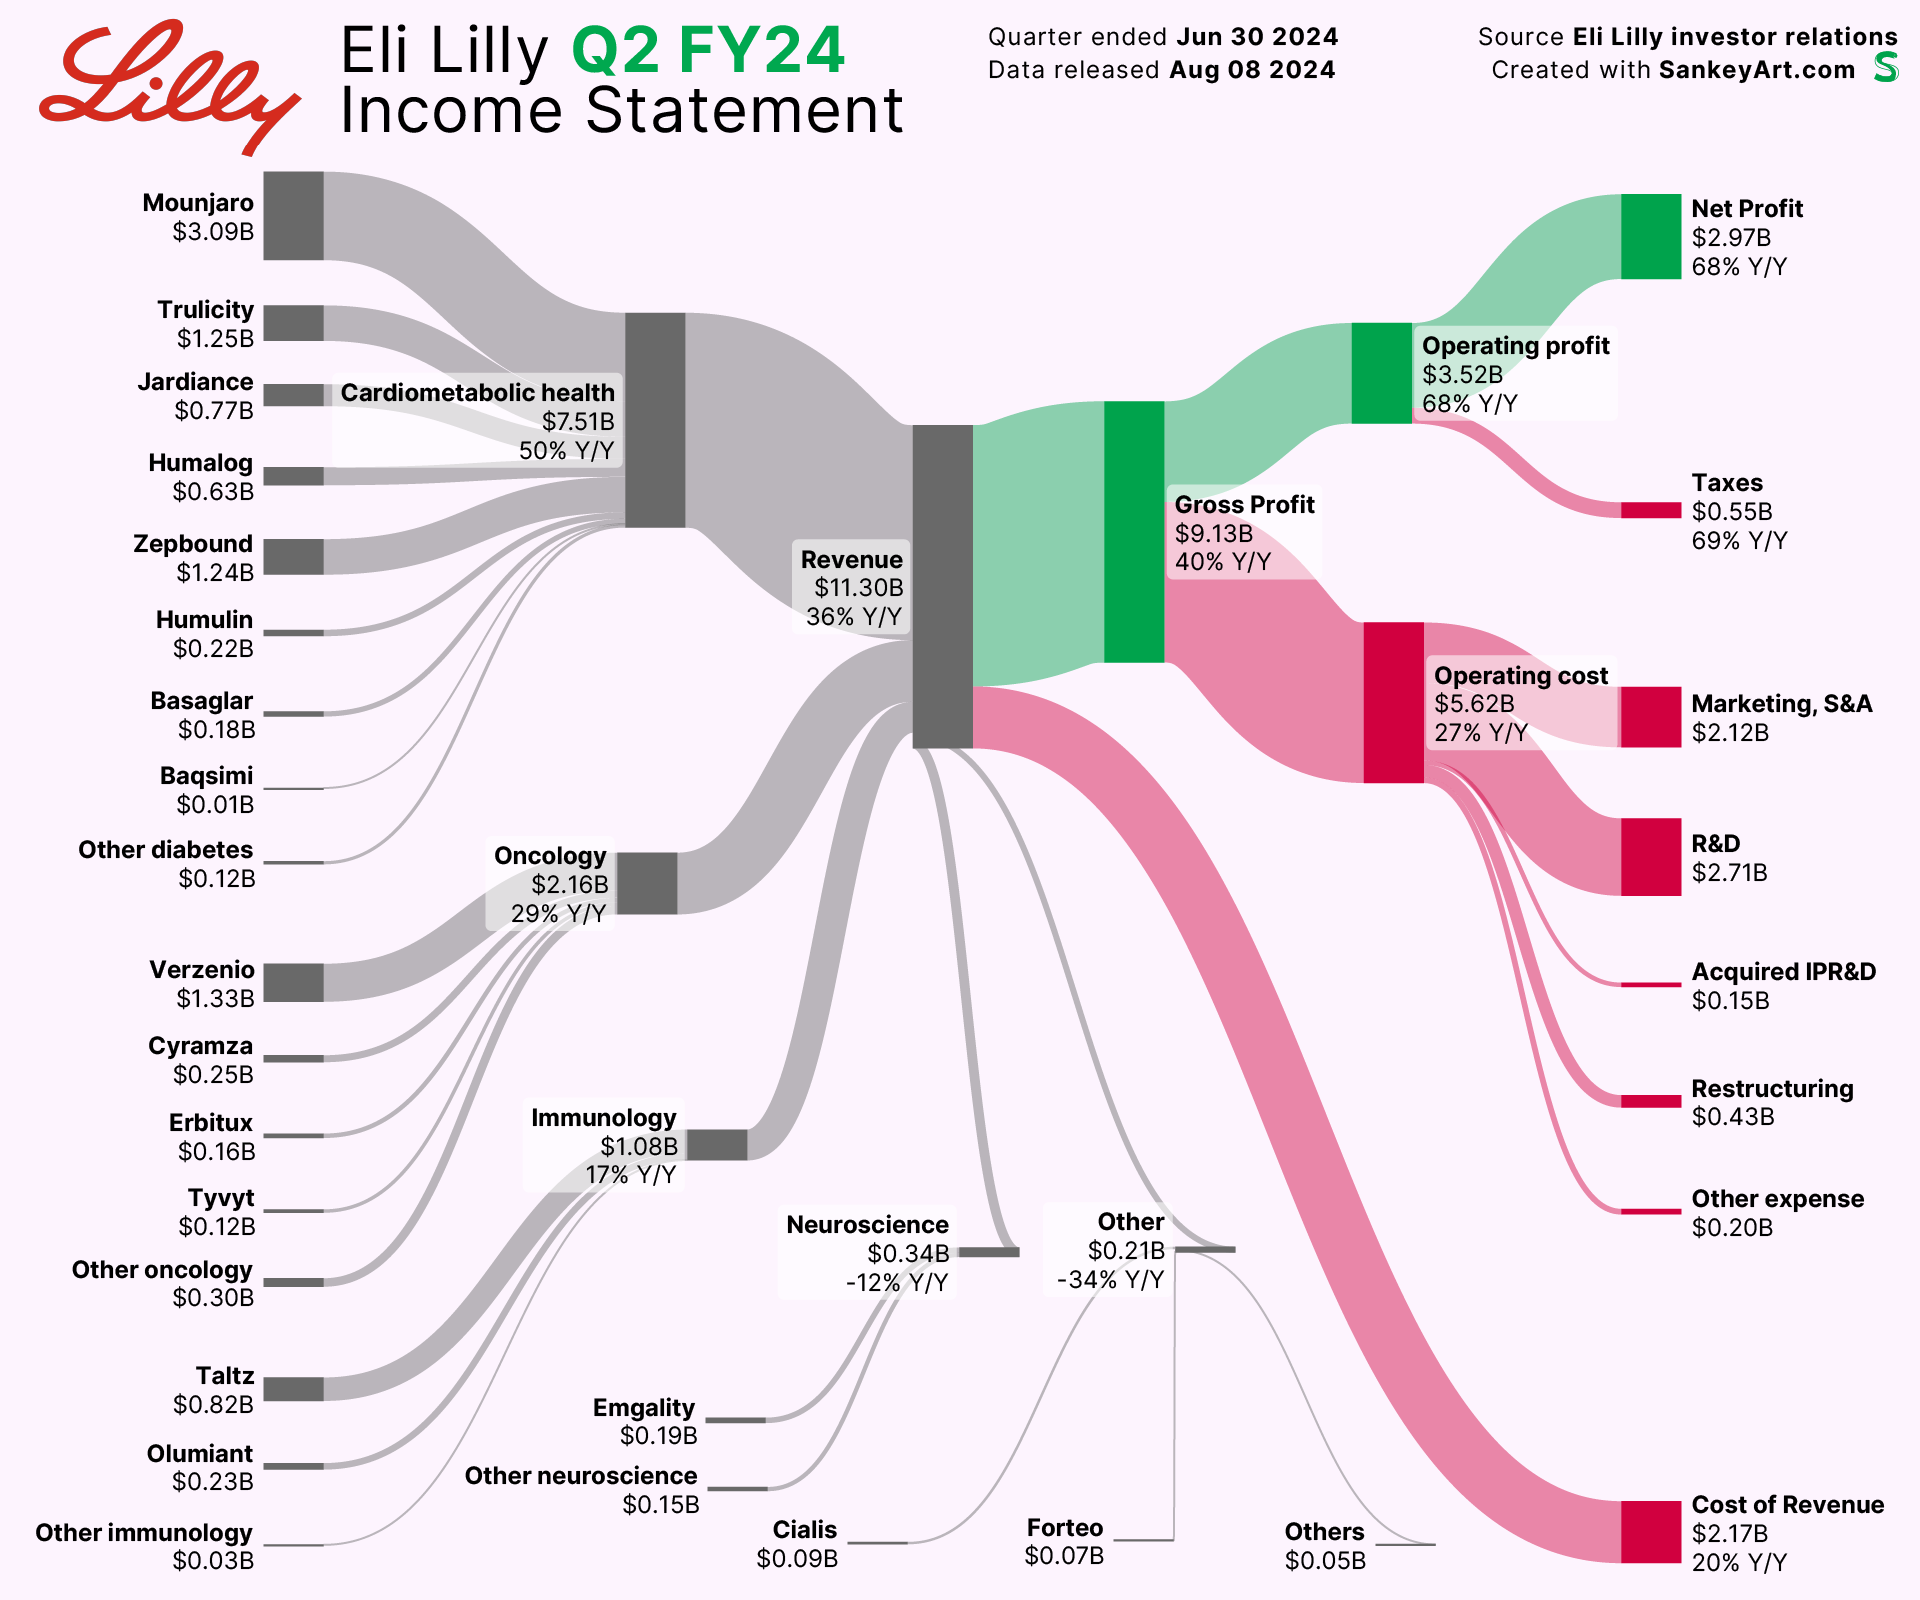
Eli Lilly's Q2 FY24 income statement reveals robust growth across its diverse product lines. The company's total revenue reached $8.31 billion, with significant contributions from various therapeutic categories. Notably, the diabetes product line emerged as a major revenue driver, showcasing the strength of Eli Lilly's portfolio in addressing chronic health conditions. The strong performance across product lines underscores the company's strategic focus on innovation and market expansion.
The cardiometabolic health category demonstrated remarkable growth, with total revenue of $7.51 billion, marking a 50% year-over-year increase. Key products in this category include Mounjaro, which generated $3.09 billion, Trulicity with $1.25 billion, Jardiance at $0.77 billion, and Humalog contributing $0.63 billion. The oncology segment also performed well, with revenue reaching $2.16 billion, a 29% year-over-year growth. Verzenio led the oncology product line with $1.33 billion in revenue, followed by Cyramza and Erbitux, which contributed $0.25 billion and $0.16 billion, respectively. The immunology category generated $1.08 billion in revenue, reflecting a 17% year-over-year increase, driven by products like Taltz and Olumiant.
| Product Line | Revenue | Year-over-Year Growth |
|---|---|---|
| Mounjaro | $3.09 billion | 50% |
| Trulicity | $1.25 billion | 50% |
| Jardiance | $0.77 billion | 50% |
| Humalog | $0.63 billion | 50% |
| Verzenio | $1.33 billion | 29% |
| Cyramza | $0.25 billion | 29% |
| Erbitux | $0.16 billion | 29% |
| Taltz | $0.82 billion | 17% |
| Olumiant | $0.23 billion | 17% |
Other notable products contributing to revenue include Emgality, which generated $0.19 billion, and Cialis, with $0.09 billion in revenue. Eli Lilly's diversified product portfolio and strategic investments in research and development have enabled the company to achieve substantial revenue growth across multiple therapeutic areas. This diversified growth ensures a stable and resilient revenue stream, positioning Eli Lilly favorably for future market challenges and opportunities.
Final Words
Eli Lilly's Q2 FY24 financial results demonstrate significant growth, with total revenue reaching $8.31 billion—a 15% increase from Q2 FY23.
Key drivers include a 10% rise in sales volume and a 5% increase in prices, with standout performances from Trulicity and Jardiance.
Cost control measures yielded improved gross profit margins, while operating expenses, although higher, were managed effectively.
Looking ahead, Eli Lilly maintains robust revenue guidance for the full year 2024, predicting earnings between $32 billion and $33 billion.
Impressive net income and earnings per share figures further highlight the company's strong financial position.
Interested in ongoing financial trends?
The Eli Lilly Q2 FY24 Income Statement provides a detailed snapshot, underlining sustained growth and strategic success.

