
Jobs and Careers
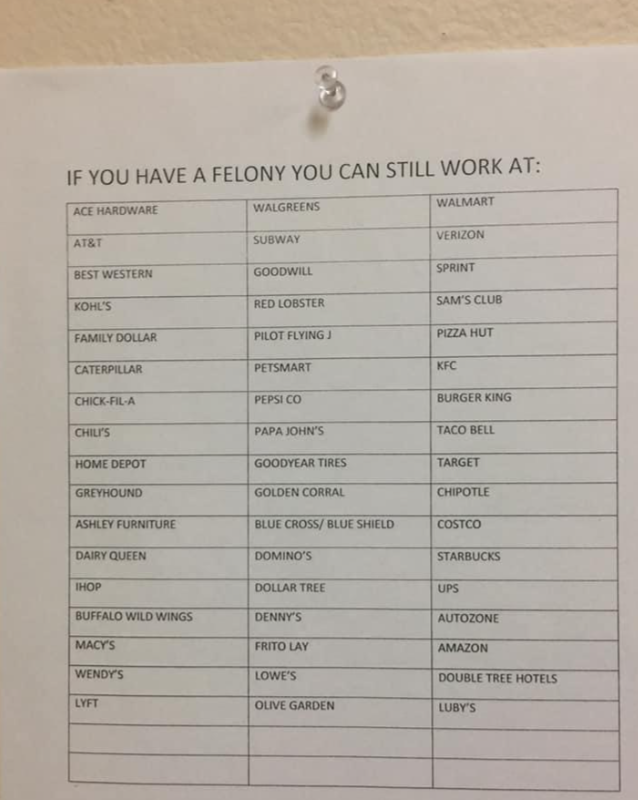
Felon Friendly Jobs, a Flyer Listing 51 Employers
This photo shows a printed flyer of felon friendly jobs, headed If you have a felony you can still work at, naming 51 US employers such as Walmart, Home…
This hub is for anyone looking for work or planning a career, including interview checklists, professional skills, pay by level and country, working hours and employment trends. Every page credits the original creator, writes out the full graphic and adds context from the source data. Readers most often use the job interview checklist, 15 essential skills for professional development, annual working hours by country, software engineer levels and pay and a career flowchart for students. Several pages compare pay and working hours across OECD countries.
This photo shows a printed flyer of felon friendly jobs, headed If you have a felony you can still work at, naming 51 US employers such as Walmart, Home…
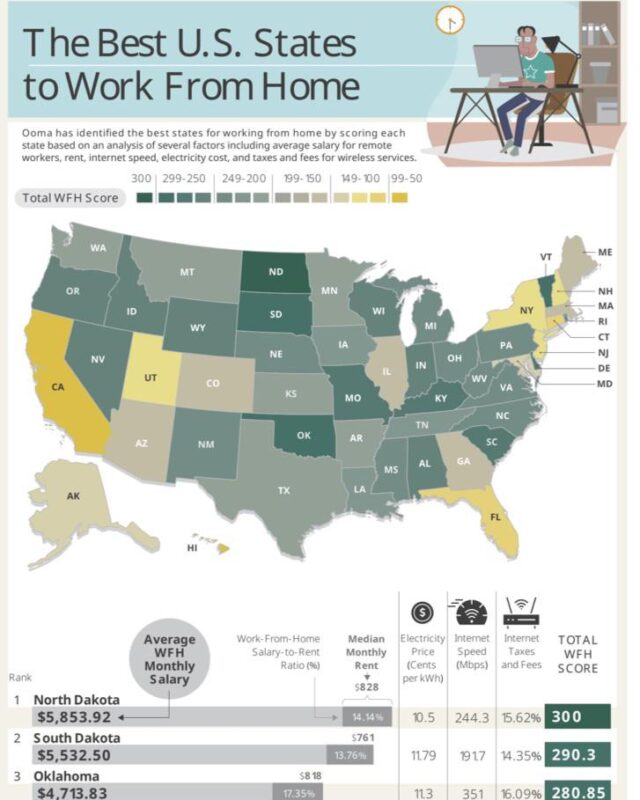
North Dakota comes first with 300 points, followed by South Dakota and Oklahoma, while Florida, Hawaii and California sit at the bottom.

Median total compensation ranges from $231k at entry level to $1.45M for a principal engineer at Facebook.

Mexico works longest, about 41 hours a week for one of the lowest wages, while Germany, Norway and Denmark work about 26 to 27 hours for more than $1,000.
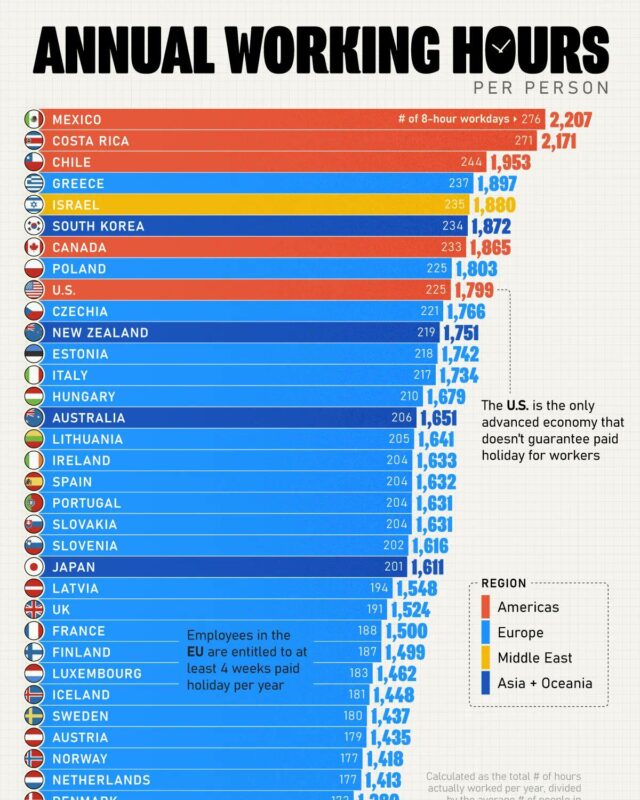
Mexico tops it at 2,207 hours per person in employment, about 276 eight-hour days, and Germany is lowest at 1,343.

Home health and personal care aides lead with 820,500 new jobs, and five other health roles make the list, from registered nurses to nurse practitioners.

Software jobs grew from about 0.9 million to about 4.1 million, while hardware jobs fell from about 1.2 million to about 0.64 million and have been flat…

Their share of US jobs fell to 19% in the 1960s, peaked at 29% in the late 1980s as Baby Boomers reached that age, and has held near 22% since the 2000s.

In a widely shared survey of 2,000 bosses, 67% named failure to make eye contact and 47% said knowing little about the company was the most common mistake.
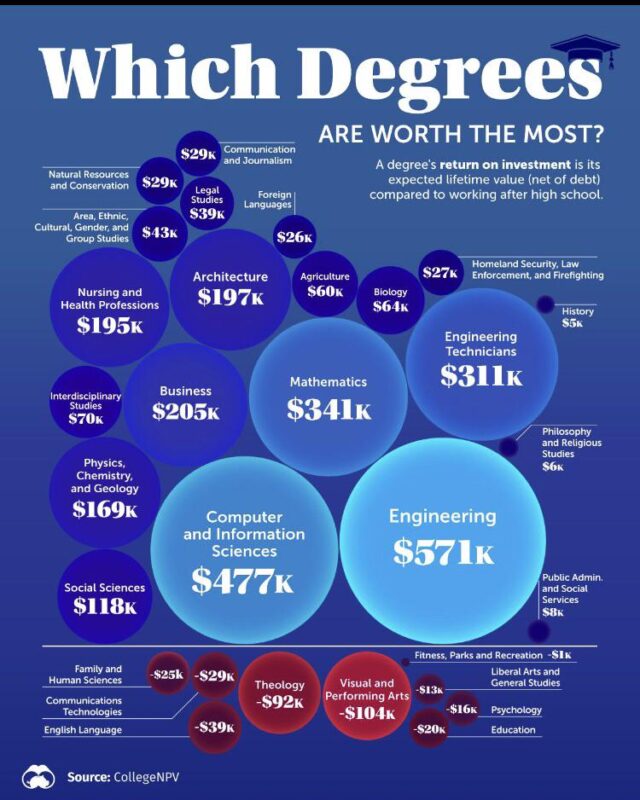
Nine fields, led by visual and performing arts (minus $104,000) and theology (minus $92,000), leave the typical student worse off than going straight into work.
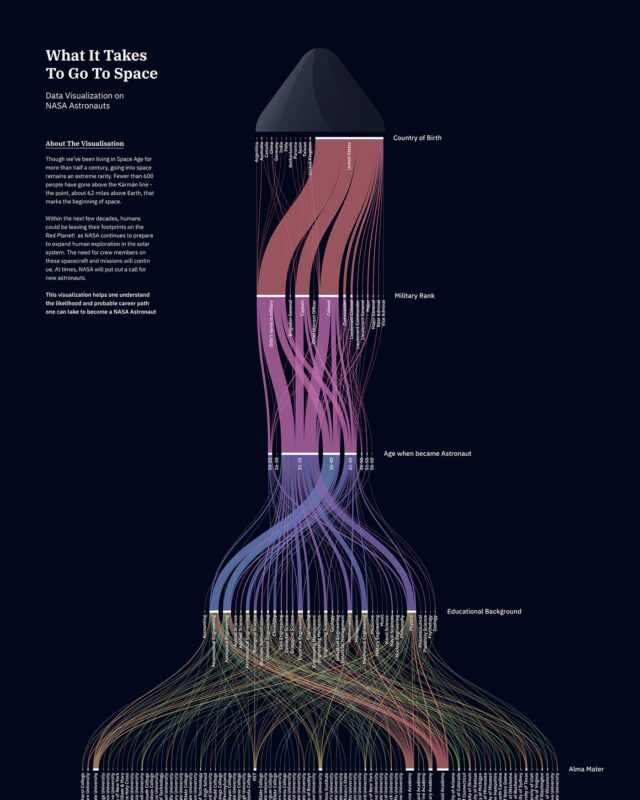
This NASA data visualization traces that path, and NASA's records of the 357 astronauts selected from 1959 to 2009 put numbers on it: 94% were born in the…

Essential skills are the personal and social skills that help you do any job well, such as reliability, honesty, teamwork, adaptability, accountability and…
The 17 infographics here cover five areas. Job hunting covers an interview checklist, body language mistakes in interviews, a career flowchart for students and a flyer of felon friendly employers. Skills pieces list 15 essential skills and nine tools for setting priorities. Pay covers software engineer levels, minimum wages in 67 countries and the return on 30 US degree subjects. Working time compares annual and weekly hours across OECD countries and ranks US states for remote work. Employment trends track US tech jobs, healthcare job growth and workers aged 25 to 34. Two lighter pieces illustrate medieval jobs and the backgrounds of NASA astronauts.
For interviews, the Job Interview Checklist for Before, During and After by Will McTighe sets out 23 steps, from planning to arrive 10 to 15 minutes early to sending a thank-you email within 24 hours. Common Interview Mistakes in Body Language, by Share of Bosses adds that 67% of bosses in a survey of 2,000 named failure to make eye contact.
On hours, Annual Working Hours by Country in 2023, OECD Ranking by Marcus Lu and Miranda Smith of Visual Capitalist puts Mexico top at 2,207 hours a year and Germany lowest at 1,343, with the UK 24th at 1,524. Genuine Impact's Working Hours vs Salary in 35 OECD Countries, Bubble Chart shows the weekly picture. Mexico works about 41 hours, while Germany, Norway and Denmark work about 26 to 27 hours for more than $1,000.
On pay, the Levels.fyi chart Software Engineer Levels and Pay at Top Companies, 2024 runs from $231k at entry level to $1.45M for a principal engineer at Facebook. For career planning, the USAFacts Healthcare Careers Infographic, 20 Jobs With the Most Growth shows home health and personal care aides adding 820,500 jobs from 2023 to 2033. Visual Capitalist's Degree Return on Investment by Field, 30 US Majors Ranked puts engineering first at $571K.
Mexico, at 2,207 hours a year per person in employment in 2023, according to the Annual Working Hours by Country chart by Marcus Lu and Miranda Smith of Visual Capitalist. Germany is lowest of the 34 countries at 1,343 hours.
Visual Capitalist's map of 67 countries in January 2023 puts Luxembourg highest at $2,140 a month after tax, with Australia second at $2,022. Nigeria is lowest at $68.
Engineering, at $571K, according to the Voronoi chart by Visual Capitalist ranking 30 US fields of study. Computer and information sciences follows at $477K, and visual and performing arts is lowest at -$104K.
Give it a permanent page where people looking for your subject find it, with your name and a link to your site. Content marketers, agencies, designers and researchers all list here.