
Health and Fitness
Human Deaths by Animals Per Year, the Deadliest Animals
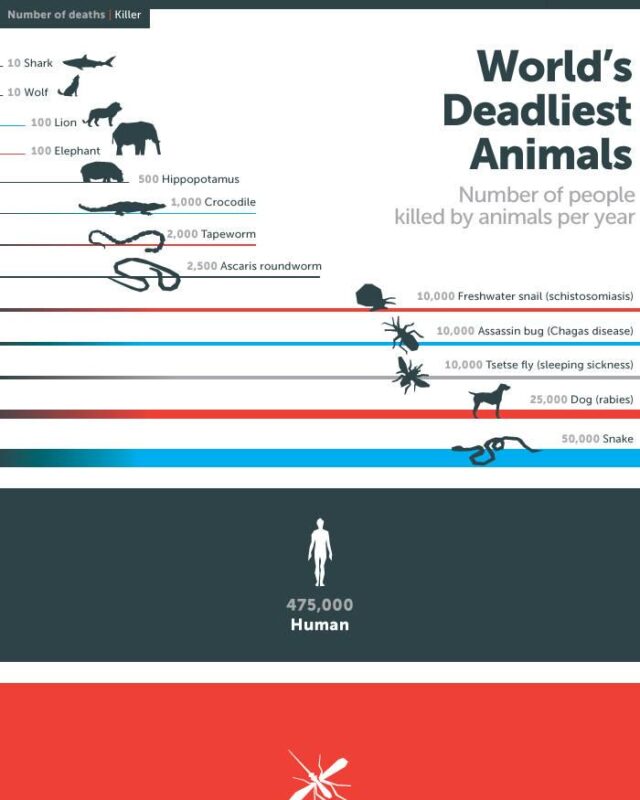
Mosquitoes kill 725,000 people a year, mostly through disease, followed by humans at 475,000 and snakes at 50,000.
These infographics cover wild animals, pets and farm animals, including how they see, sleep, run and how long they live, plus practical guides for dog owners and chicken keepers. Each page credits the artist, writes out every species on the graphic and checks the claims against published research. Popular pages include the 16 Myers-Briggs types as animals, animal colour vision, cheetah speed and anatomy, average daily sleep for 40 species and the lifespan of animals from mayfly to jellyfish. Wildlife decline and the animals most dangerous to people are covered too.
Mosquitoes kill 725,000 people a year, mostly through disease, followed by humans at 475,000 and snakes at 50,000.

It groups 40 animals, including humans, into four bands of 5 hours.
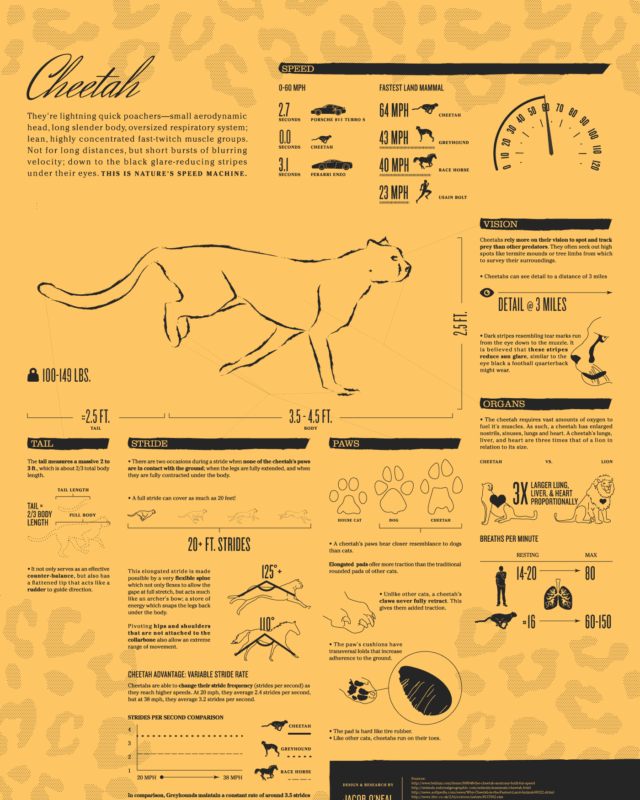
It gives a top speed of 64 mph and 0 to 60 mph in 3.0 seconds, and shows how the spine, stride, oversized organs, tail and paws make that possible.
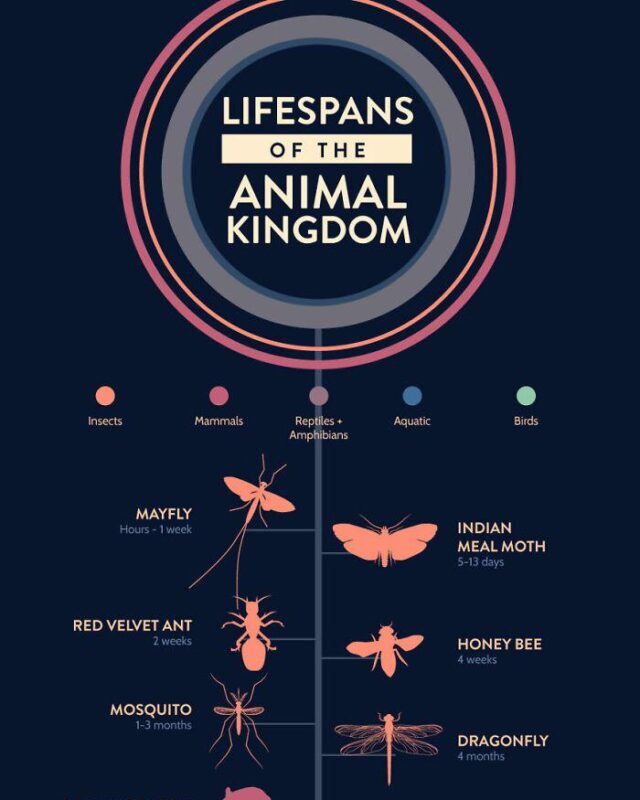
Most mammals on it live between 1.5 and 50 years.

Russia had the highest rate of cat ownership at 57%.

Africa is close behind, while Europe and North America show smaller falls, partly because much of their wildlife was lost before 1970.
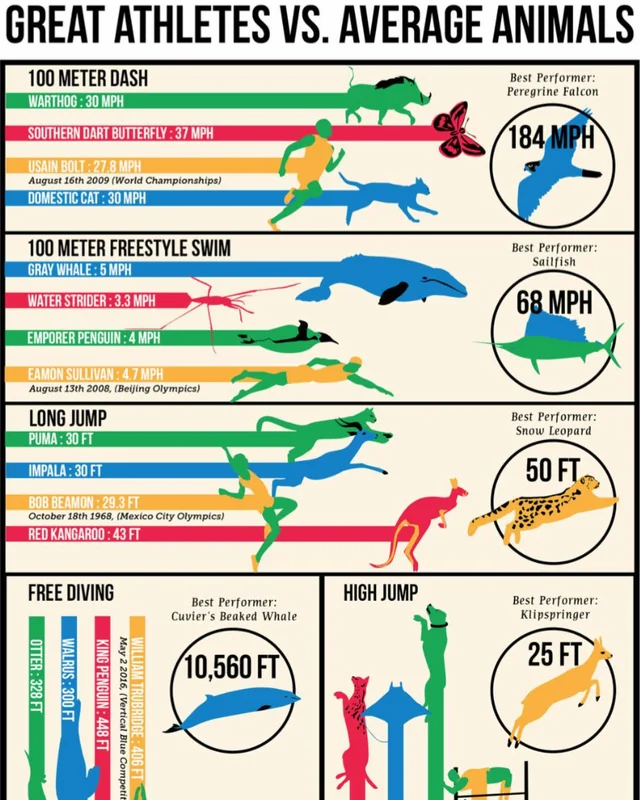
A cheetah runs at up to 65 mph against Usain Bolt's top speed of 27.56 mph, a red kangaroo can bound as far as the long jump world record, and Cuvier's…
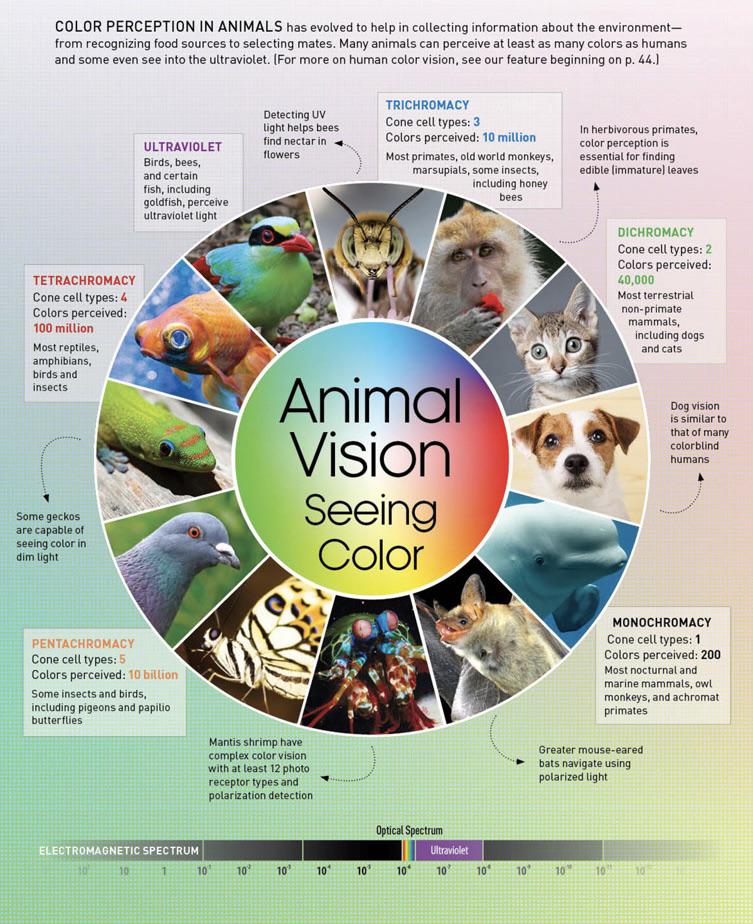
Animal colour vision depends on how many types of cone cell an animal has.
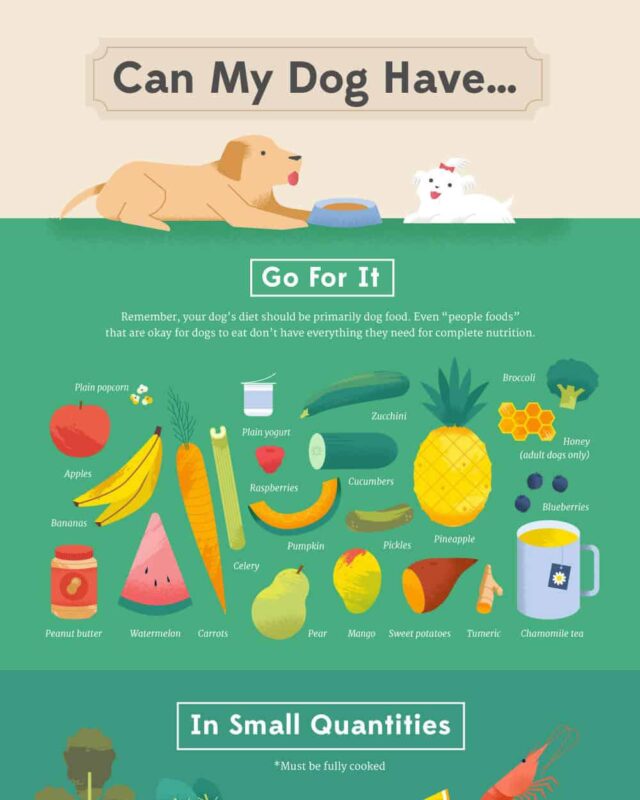
Dog food safety means knowing which foods can harm your dog and storing its food so it stays fresh and free of bacteria.
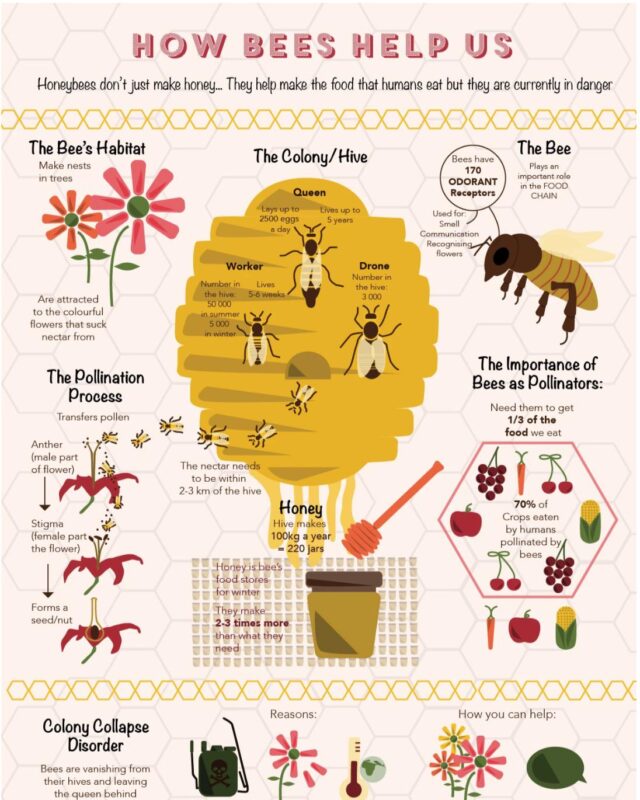
Bees help us mostly by pollinating crops.

An ant identification key names an ant through a series of yes or no questions about its body.
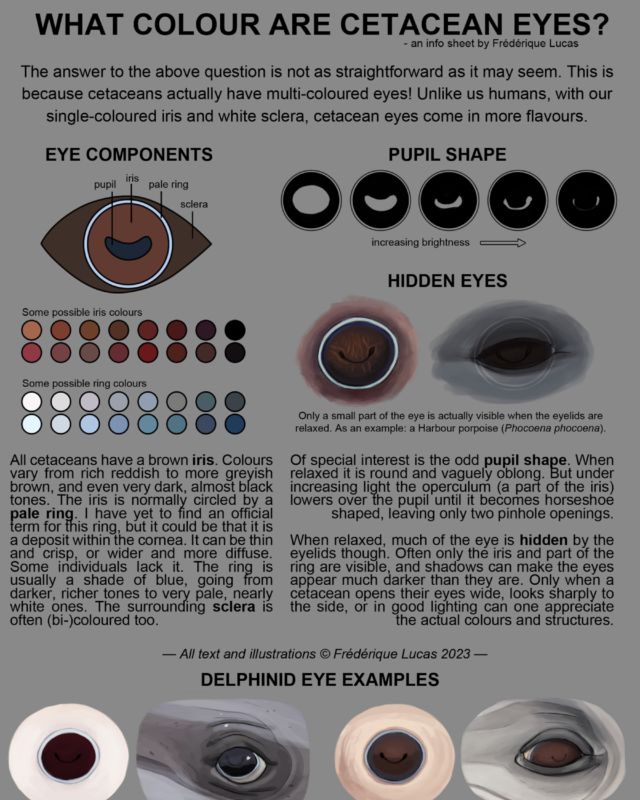
Dolphins have brown eyes, and so do all whales and porpoises.
The 15 infographics here fall into a few groups. Several deal with how animal bodies work, including colour vision, cetacean eye colour, cheetah anatomy, sleep and lifespan. Others set animals against people, through athletic records and the number of people each animal kills, or track wildlife population decline by region. For pet and animal keepers there are guides to dog food safety, chicken names and keeping predators out of a coop. There is also a survey of cat and dog ownership in 22 countries, an explainer on how a honeybee colony works and a key to 17 common urban ants. One chart matches the 16 Myers-Briggs types to animals.
For speed, Cheetah Speed and Anatomy by Jacob O'Neal gives a top speed of 64 mph and 0 to 60 mph in 3.0 seconds. It also shows lungs, liver and heart three times larger than a lion's in proportion to body size. Athletic Animals Compared With Great Human Athletes sets five world records against ordinary animals. It shows a domestic cat at 30 mph as faster than Usain Bolt at 27.8 mph, and its notes point out where the animal figures do not stand up.
Two charts cover the range of animal life. The Animals Sleeping Time Chart covers 40 species, from the brown bat at 19 hours 54 minutes a day to the giraffe at 1 hour 54 minutes. The Lifespan of Animals Chart places 37 animals on a timeline, from the mayfly at hours to a week up to the ocean quahog clam at 410 years.
On the dangers animals pose to people and the dangers wildlife faces, Human Deaths by Animals Per Year, made for GatesNotes (Bill Gates), puts mosquitoes first at 725,000 deaths a year and humans second at 475,000. Wildlife Decline by Region from Latinometrics shows that monitored wildlife populations in Latin America and the Caribbean fell by an average of 95% between 1970 and 2020, against 73% worldwide.
The mosquito, at 725,000 human deaths a year, mostly through the diseases it carries, according to the chart made for GatesNotes (Bill Gates). Humans come second at 475,000, and sharks and wolves kill about 10 people a year each.
The Animals Sleeping Time Chart puts the brown bat at the top, at 19 hours 54 minutes a day. The giraffe sleeps the least, at 1 hour 54 minutes, just below the African elephant at 2 hours.
Argentina, where 66% of people own a dog, followed by Mexico at 64% and Brazil at 58%, according to a GfK survey published in 2016. In the same survey Russia leads for cats at 57%.
Give it a permanent page where people looking for your subject find it, with your name and a link to your site. Content marketers, agencies, designers and researchers all list here.