


Football
Premier League Revenue by Club, First 31 Seasons
Manchester United earned the most, £8,958.7m, ahead of Chelsea, Liverpool, Arsenal and Manchester City, each with about £6.3 to £6.5 billion.
These infographics cover companies and how they make money, including revenue and profit rankings, market value over time, product cost breakdowns, startup deals and survival rates, with a section on marketing and design. Each page credits the original creator, gives the full data as text and checks the headline figures against the source. Popular pages include Fortune Global 500 revenues compared with country GDP, the largest companies in the world by revenue, the largest companies by market cap in 1997 and 2025, the iPhone cost breakdown and Apple income and the six principles of graphic design.
Manchester United earned the most, £8,958.7m, ahead of Chelsea, Liverpool, Arsenal and Manchester City, each with about £6.3 to £6.5 billion.
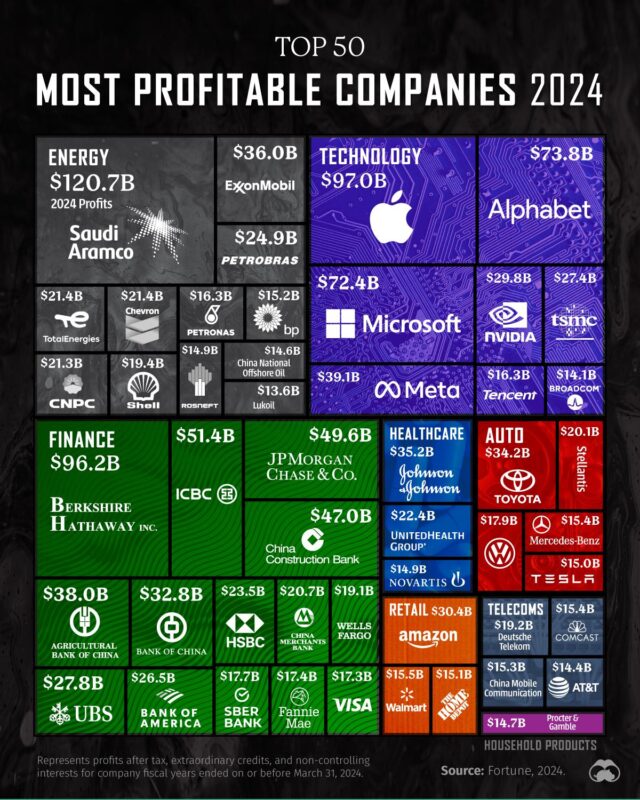
Saudi Aramco leads with $120.7 billion, ahead of Apple at $97.0 billion and Berkshire Hathaway at $96.2 billion.
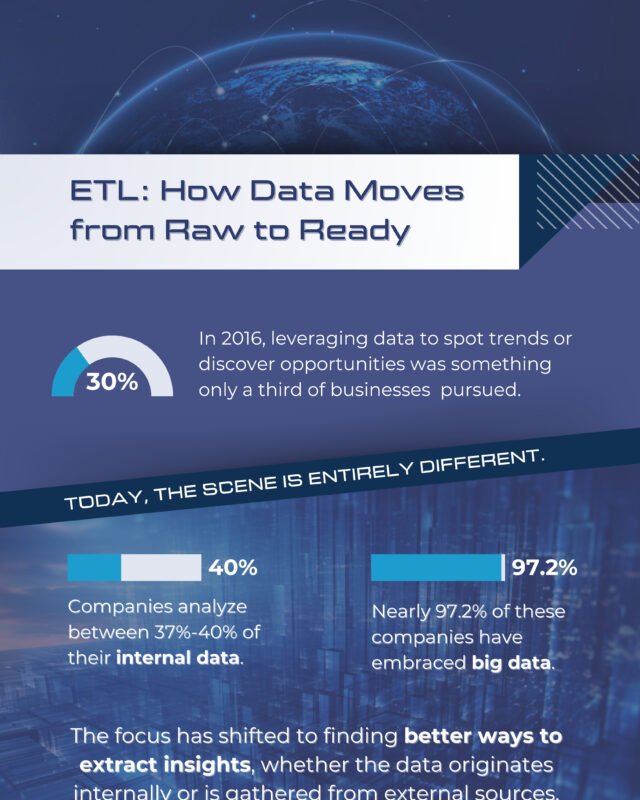
The graphic also covers four types of ETL, claimed business results, 17 tools and five steps to implement it.

This chart of service industry operating margins in Mexico, made by the Margin newsletter with tukan data, compares each sector's margin in 2018 with an…

Walmart leads at $648 billion, followed by Amazon and China's State Grid.

General Electric fell from 1st to 68th, Intel to 206th, and only Microsoft moved up, to 3rd at $3.17 trillion.

The RAV4 led with 475,193 units, ahead of the Camry and Corolla, and hybrids made up 41.3% of sales.
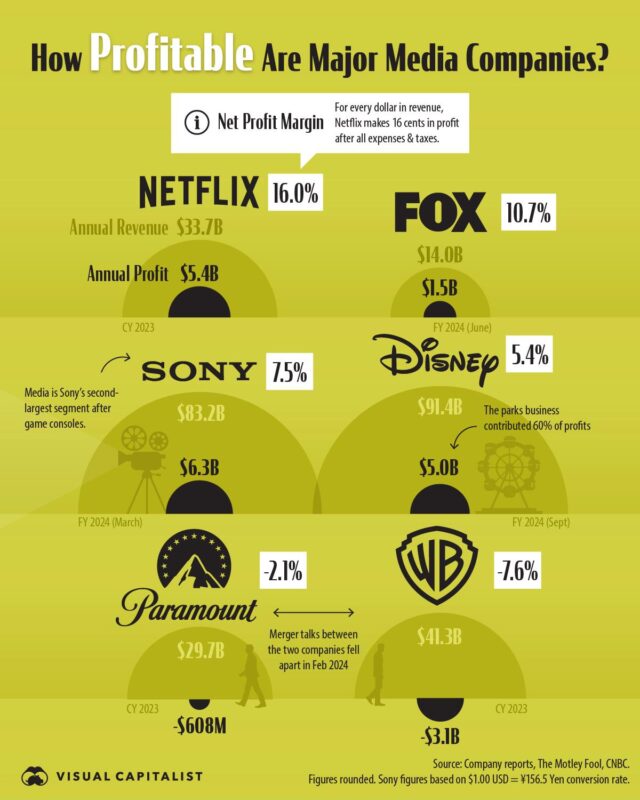
Netflix leads at 16.0%, making 16 cents of profit per dollar of revenue, ahead of Fox, Sony and Disney.
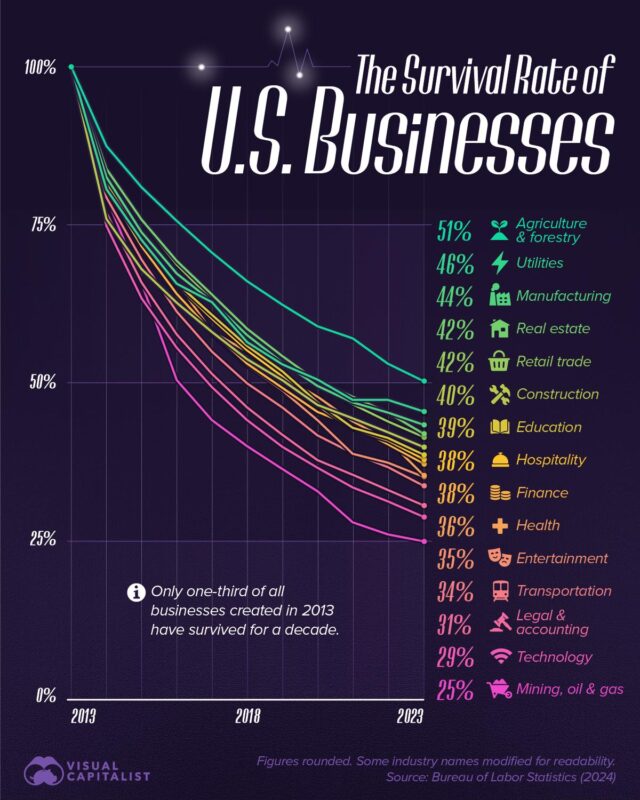
Agriculture and forestry held up best, with 51% surviving to 2023, while mining, oil and gas fared worst at 25%.

Digital entertainment apps such as Netflix and Disney+ took $8.2 billion, ahead of dating apps at $5.7 billion and short video apps at $4.3 billion.

Extreme weather came first, chosen by 66%, followed by AI-generated misinformation and disinformation at 53% and societal and political polarisation at 46%.

Alphabet leads with 222 deals worth $16.6 billion, ahead of Microsoft with 140 and Cisco with 134, while Salesforce spent the most at $61.5 billion.
The 30 infographics fall into four groups. Most rank companies by revenue, profit, margin or market value, from the world's largest firms to medical products makers and media companies. Others break down one company's results, such as Apple's iPhone quarter and Eli Lilly's second quarter of 2024, or track an industry, including steel production, US Toyota sales, Premier League club revenue and app spending. A third set covers startup acquisitions and survival rates, and the last explains working methods such as ETL, business intelligence and the 12 agile principles.
For the biggest firms, begin with Largest Companies in the World by Revenue, Top 35 from Visual Capitalist, where Walmart leads at $648 billion, followed by Amazon at $575 billion and State Grid of China at $546 billion. Its companion, Most Profitable Companies 2024, the Top 50 by Profit, uses the same Fortune data and puts Saudi Aramco first with $120.7 billion, ahead of Apple at $97.0 billion.
Yahoo Finance's Largest Companies by Market Cap in 1997 and in 2025 shows General Electric falling from 1st to 68th, while Microsoft rose from 5th to 3rd at $3.17 trillion. For one company in detail, Lirim Zenuni's iPhone Cost Breakdown and Apple Income, Q1 2024 estimates that $42.2 billion of $69.7 billion in iPhone revenue went on cost of goods, with the A17 Bionic chip the largest component at $9.5 billion.
On new businesses, Visual Capitalist's US Business Survival Rates by Industry, 2013 to 2023 finds that about one-third of private-sector businesses founded in 2013 were still operating after ten years, with agriculture and forestry best at 51% and mining, oil and gas worst at 25%. Startup Acquisitions, the 15 Companies That Bought the Most, also by Visual Capitalist, shows Alphabet making 222 deals worth $16.6 billion between 2000 and the first half of 2024, while Salesforce spent the most, $61.5 billion.
Pieces on design principles, logo colours, brand asset management and local marketing sit in the Marketing and Design section.
Walmart, at $648 billion, according to Visual Capitalist's Largest Companies in the World by Revenue chart. It uses Fortune figures for fiscal years ending by 31 March 2024, and Amazon is second at $575 billion.
About one-third of US private-sector businesses founded in 2013 were still operating in 2023, according to Visual Capitalist's US Business Survival Rates by Industry chart. The Bureau of Labor Statistics puts the figure at 34.7% for all private-sector establishments.
Pokémon, with estimated all time revenue of $147 billion, of which $103 billion came from merchandise, on the chart by Voronoi by Visual Capitalist. Hello Kitty is second at $89 billion.
Give it a permanent page where people looking for your subject find it, with your name and a link to your site. Content marketers, agencies, designers and researchers all list here.