

Environment and Energy
US Hurricane History Map, Every Landfall From 1851 to 2024
Landfalls crowd the Texas, Louisiana and Florida coasts, and the only Category 5 landfalls are the 1935 Labor Day hurricane, Camille, Andrew and Michael.
This hub covers the natural world and how we use it, including temperature records, rainfall, water use, waste and recycling, deforestation, wildlife decline and emissions, with a section on energy and oil. Each page shows the original graphic with credit, gives its data as text and compares older figures with current sources. Well used pages include global water consumption and water footprints, the highest temperature ever recorded in each country, how bees help us, annual CO2 emissions by country and the largest oil reserves by country.
Landfalls crowd the Texas, Louisiana and Florida coasts, and the only Category 5 landfalls are the 1935 Labor Day hurricane, Camille, Andrew and Michael.
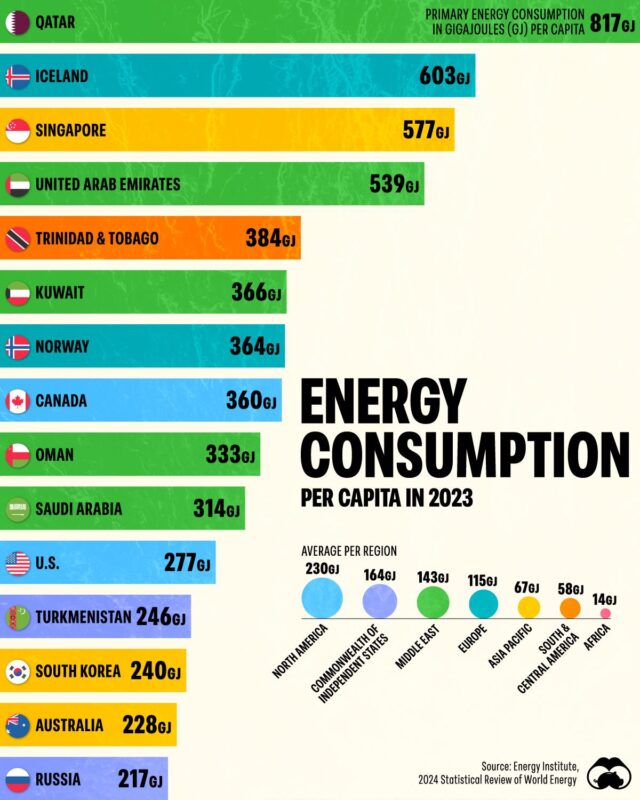
This Visual Capitalist chart ranks the top 15 countries and compares regions, from North America at 230 GJ per person to Africa at 14 GJ, using Energy…
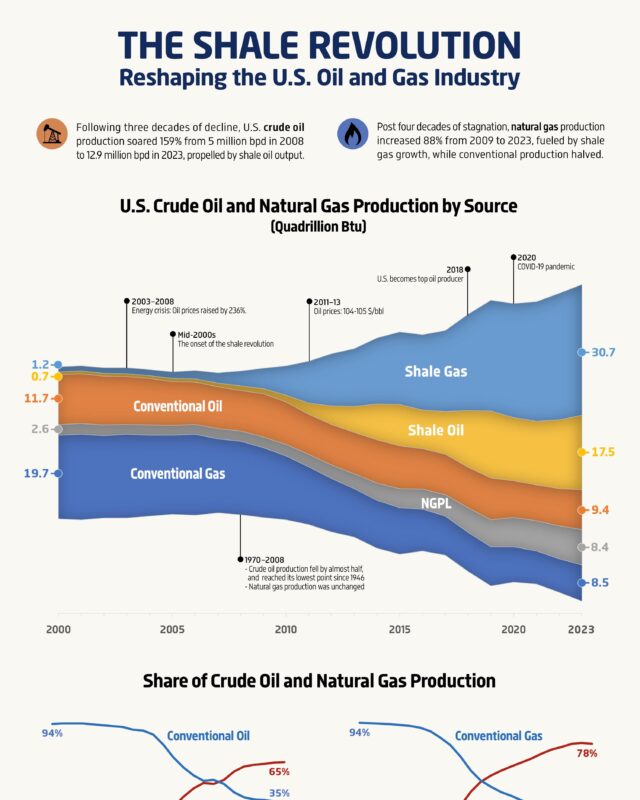
Crude oil output rose 159% from 5 million barrels a day in 2008 to 12.9 million in 2023, and natural gas output rose 88% from 2009.

The United States led at 12,927 thousand barrels per day, and Texas alone, at 5,512, out-produced every country except Russia and Saudi Arabia.

In 2023 it produced 12.9 million barrels of crude oil a day, ahead of Russia (10.6 million) and Saudi Arabia (9.6 million), out of a world total of about…

The best known US city nicknames are the Big Apple (New York City), the Windy City (Chicago), the Big Easy (New Orleans), Motor City (Detroit) and Sin City…

In 2025 the United States imported 6.17 million barrels of crude a day and exported 3.96 million, leaving net imports of 2.21 million barrels a day,…

Russia is the largest supplier, sending 2.19 million barrels a day in 2024, ahead of Saudi Arabia, Malaysia and Iraq.

That is the second highest in the EU after Ireland (39.2 cents) and about a third above the EU average of 28.8 cents.

In 2024 China bought 4,057 million barrels of crude, about 11.1 million barrels a day, and Russia supplied 803 million barrels, 19.8% of the total.
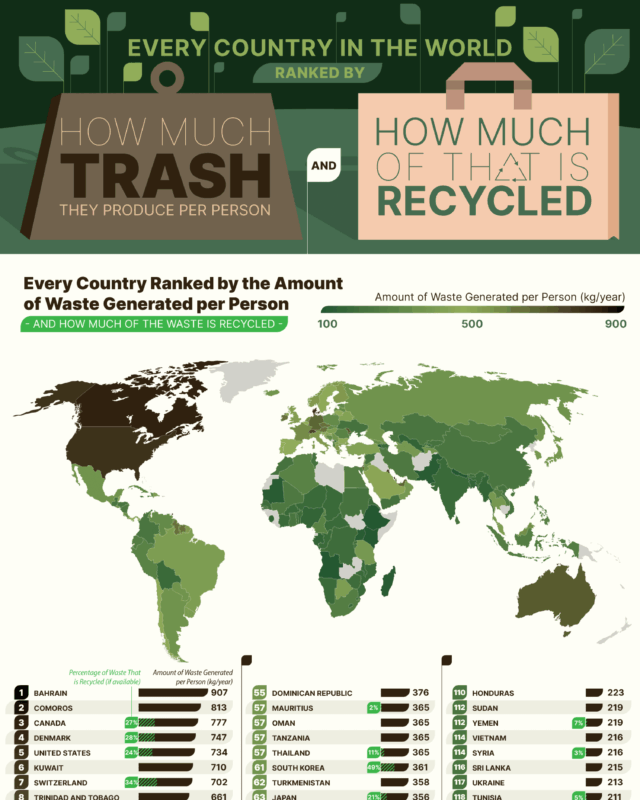
Germany recycles the most of its household and municipal waste of any country with comparable official data: 69% in 2024, according to Eurostat, ahead of…

The reading is disputed, and a 2025 study argues it was far too high.
The 32 infographics here fall into a few groups. Weather and climate pieces cover record temperatures, world rainfall patterns and every US hurricane landfall from 1851 to 2024. Resource and waste pieces cover where Earth's water is and how much we use, recycling rates by country, electronic waste, ocean plastic, sand extraction and forest loss in the Amazon. Others deal with CO2 emissions, how many Earths different lifestyles would need, bees, orchids, flower names and US crops. The largest group is about energy and oil: production, reserves, China's crude imports, gas output, electricity prices and energy use per person.
The Highest Temperature Ever Recorded by Country, World Map from Al Jazeera (AJLabs) puts the top reading at 56.7C (134F) at Death Valley, California, in 1913, and says at least 22 countries have reached 50C. Africa's record on the same map is 55C at Kebili, Tunisia, in 1931.
Two pieces on water work well together. David McCandless of Information is Beautiful shows in Global Water Distribution Infographic, Water World Chart that oceans hold 96.5% of Earth's water and only 2.5% is fresh. Global Water Consumption, Water Usage Statistics and Footprints puts the average footprint at about 1,240 cubic metres per person a year and says 70% of fresh water goes to farming. On waste, the Paper Boss ranking Which Country Recycles the Most Waste, Every Country Ranked puts Germany first at 290.0 kg per person a year, with Singapore recycling the highest share, 59%.
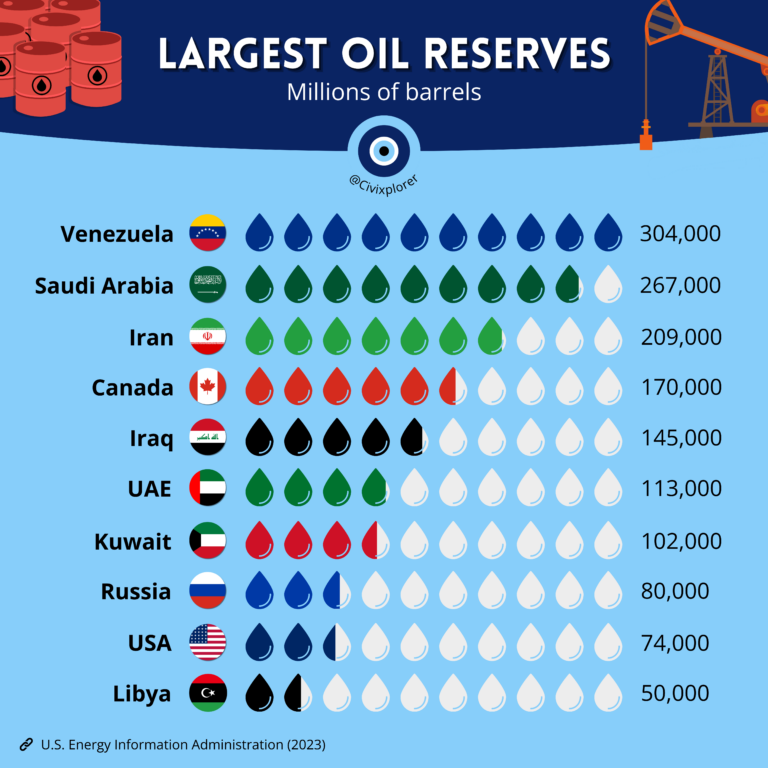
For oil, Civixplorer's Largest Oil Reserves by Country, the Top 10 Ranked puts Venezuela first with 304,000 million barrels in 2023 EIA figures. Ehsan Soltani of Econovis maps Oil Production by Country 2023 on a World Map, with the United States leading at 12,927 thousand barrels per day out of a world total of 82,757, ahead of Russia with 10,554 and Saudi Arabia with 9,609.
More graphics on oil, gas, electricity and energy use are grouped in the Energy section.
The United States, according to the Econovis map Oil Production by Country 2023 on a World Map. It produced 12,927 thousand barrels per day in 2023. Russia was second with 10,554 and Saudi Arabia third with 9,609.
China, on Susan Stroud's No Bull chart Annual CO2 Emissions by Country, Top 10 Emitters 1800 to 2023. China ends at about 12 billion tonnes in 2023, ahead of the USA at 4.9 billion and India at 3.1 billion.
Each page writes out the graphic in text, checks its claims against sources listed on the page and corrects mistakes in a note. Where a graphic uses older figures, as the Global Water Consumption infographic does, the notes give the current numbers.
Give it a permanent page where people looking for your subject find it, with your name and a link to your site. Content marketers, agencies, designers and researchers all list here.