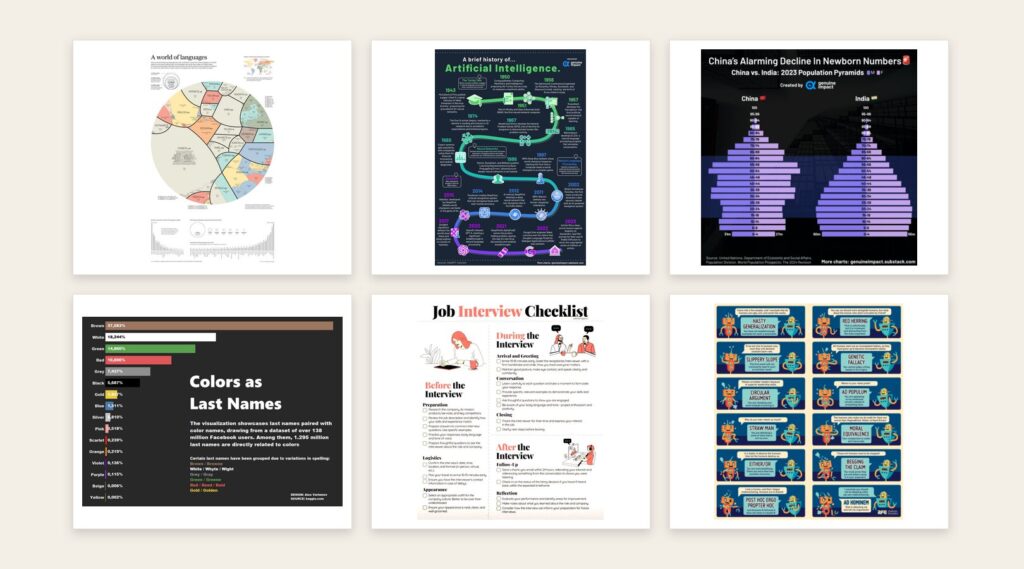
Types of Infographics
The six types of infographics you will see most often, what each one is for, when to use it and real examples…
Guides to making, researching and using infographics, written by our editors.
The six types of infographics you will see most often, what each one is for, when to use it and real examples…
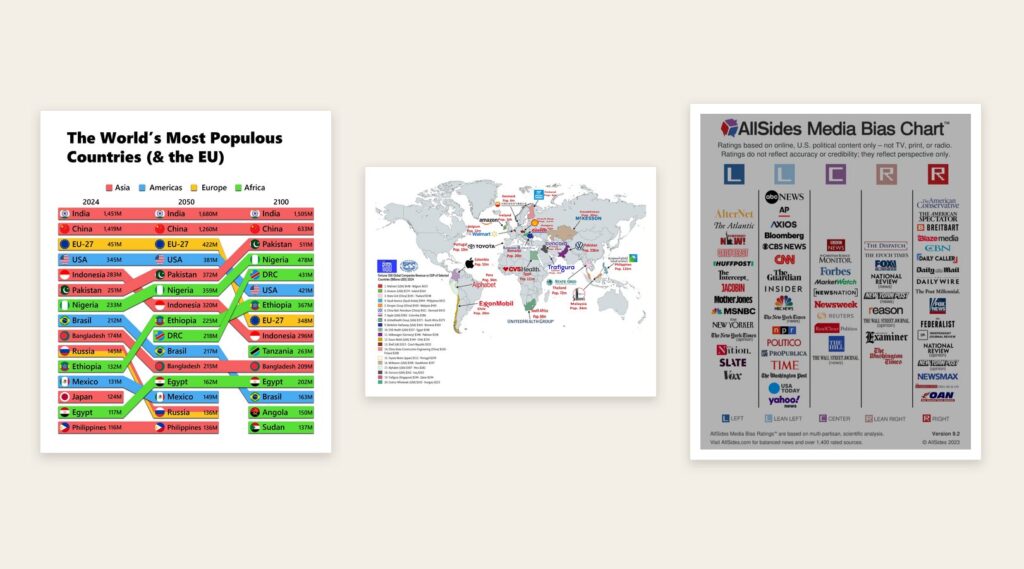
To cite an infographic, give the creator's name, the date it was published (or n.d. if there isn't one), its title, a…
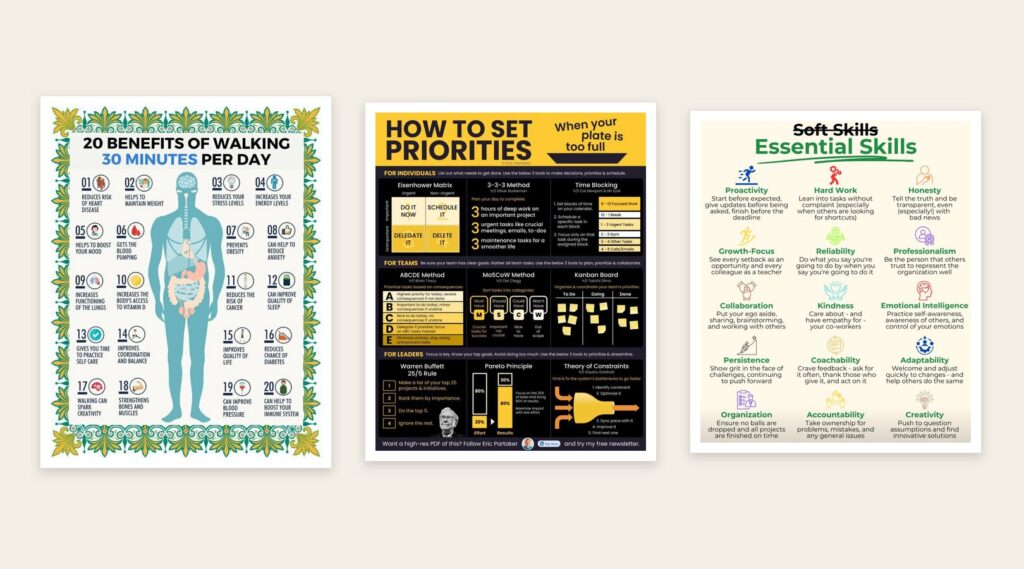
To make an infographic in Word, set the page orientation first, then build the graphic from the Insert tab. Use SmartArt for…
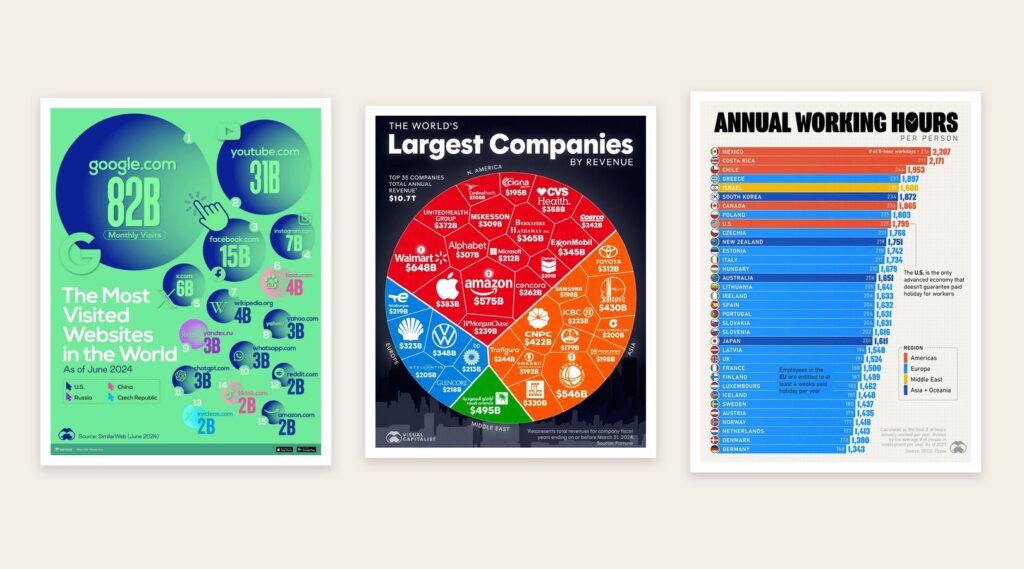
To use infographics to generate leads, publish each graphic on its own landing page with a short written summary, then give readers…
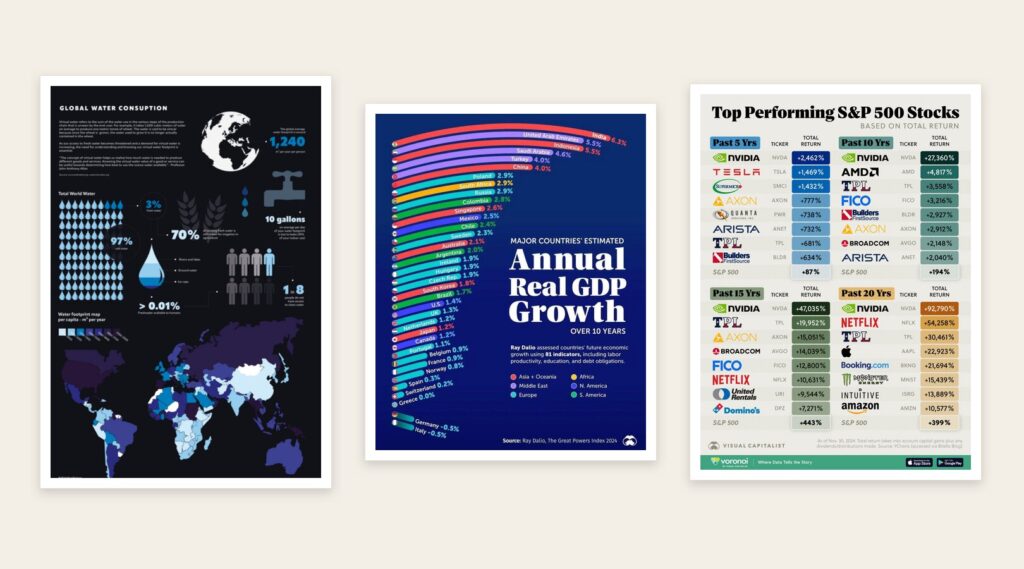
Infographics increase traffic to your website when each one has its own page with a written summary and then gets seen in…
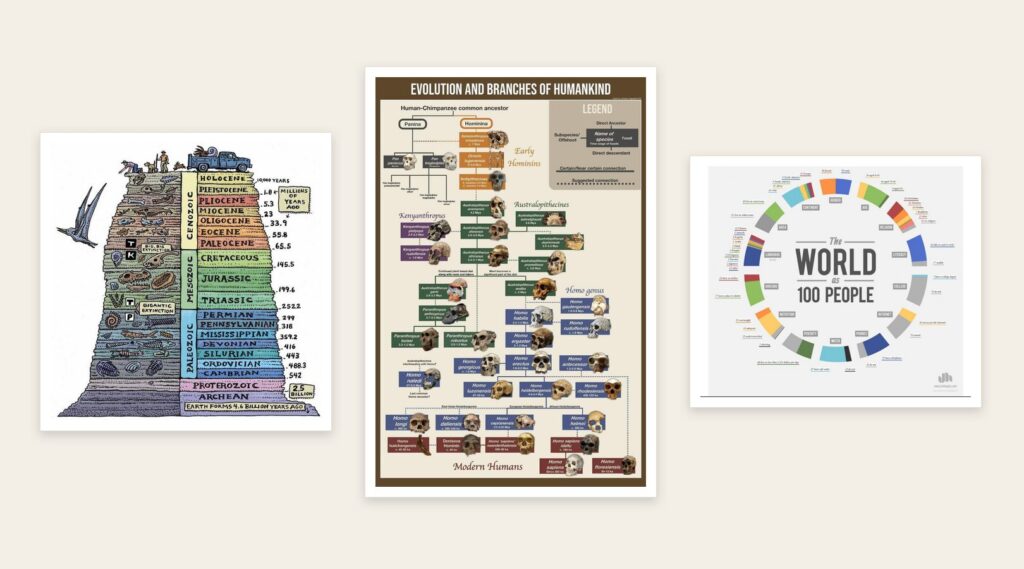
To research an infographic, start with one clear question and the people it is for, then find the numbers in primary sources…
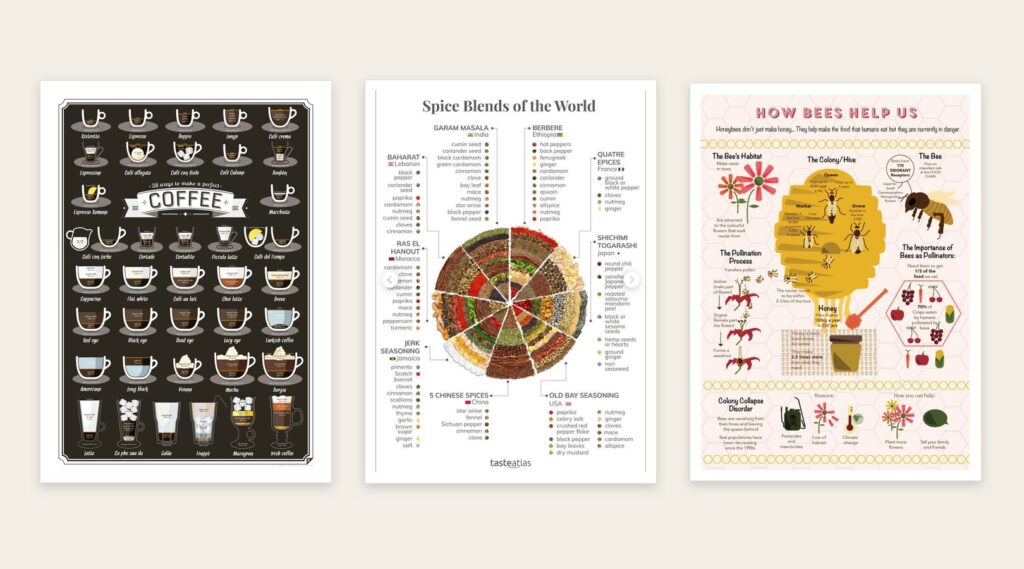
To make an infographic in an hour, pick one message and five or six facts, then build it from a template in…
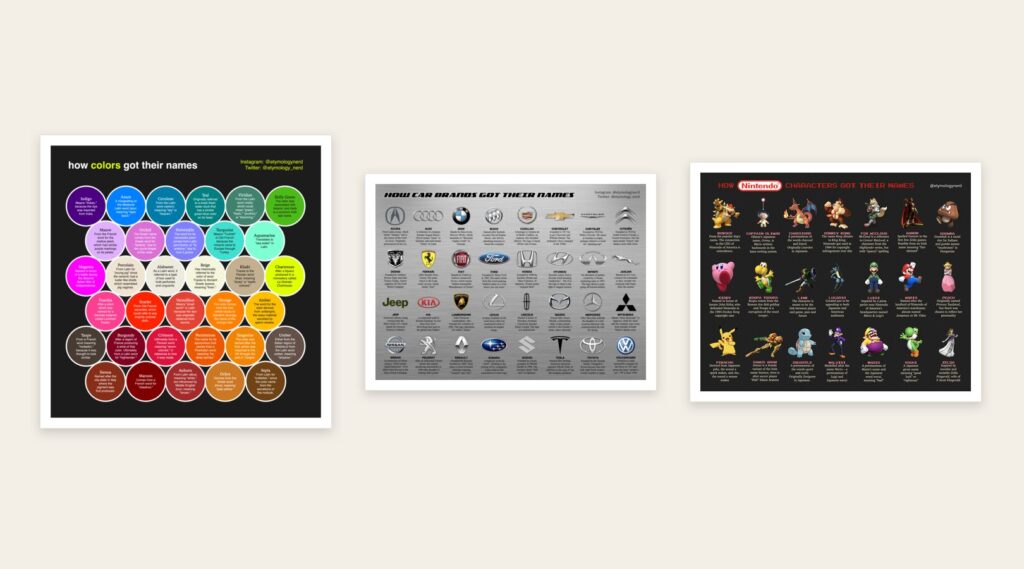
The best software to make infographics for most people is Canva. Its free plan includes over 1.6 million templates, charts and PNG…
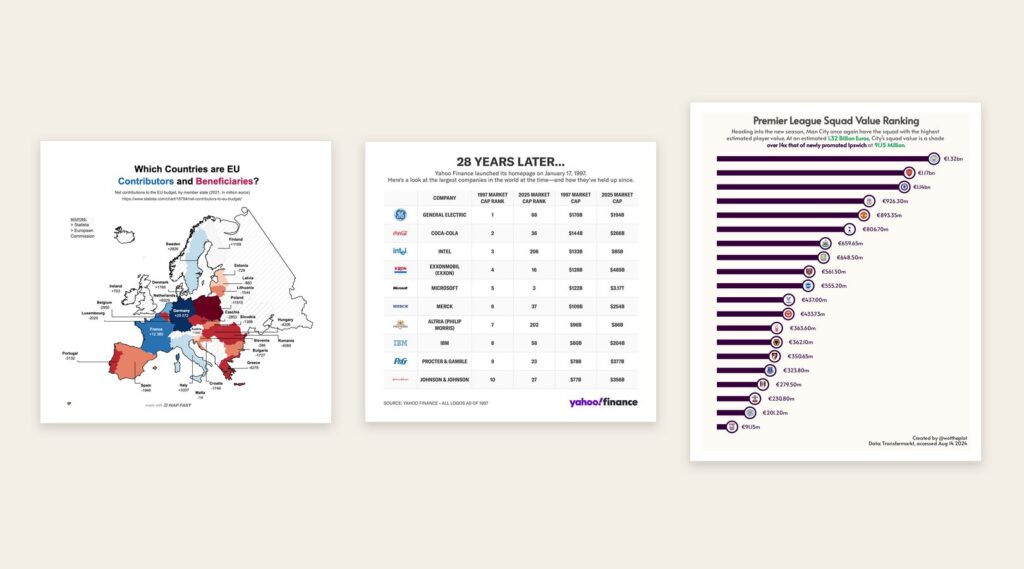
To optimise an infographic for SEO, publish it on its own page with a short written summary of its main points, give…
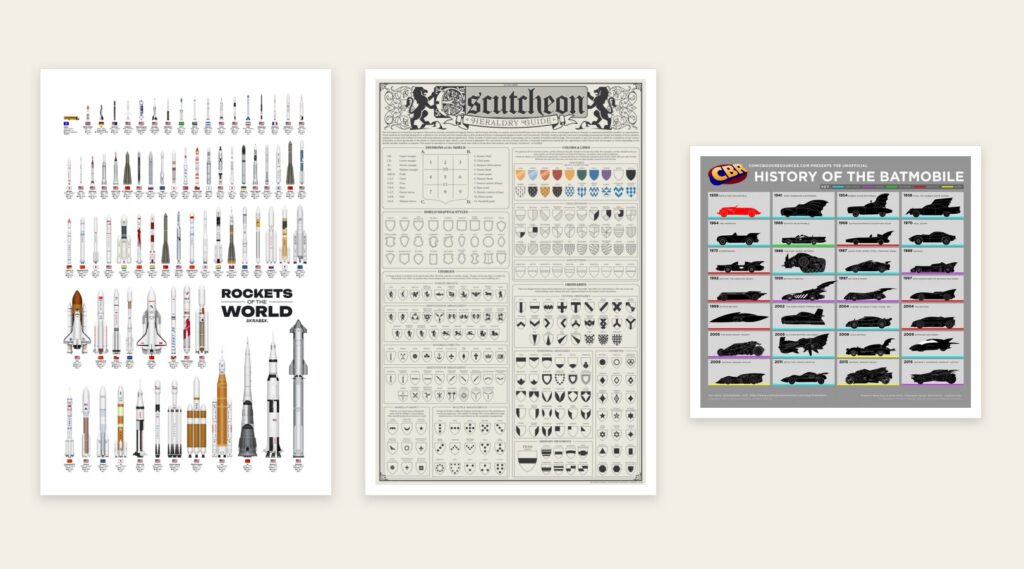
Practical tips to make your infographics stand out and get the results you want.
Give it a permanent page where people looking for your subject find it, with your name and a link to your site. Content marketers, agencies, designers and researchers all list here.