
Technology
What Is ETL? Extract, Transform and Load Explained
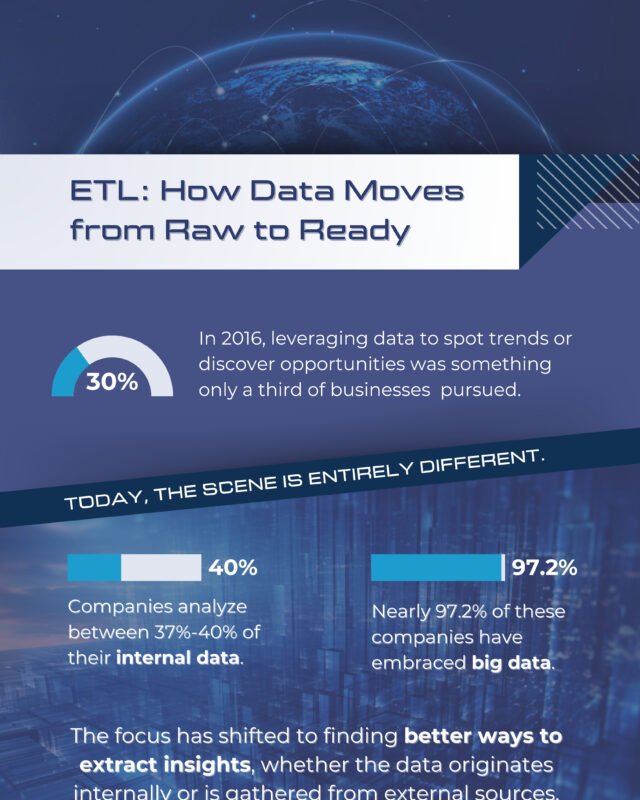
The graphic also covers four types of ETL, claimed business results, 17 tools and five steps to implement it.
This hub covers computing and the technology built on it, including artificial intelligence, chips and computing power, robots, phones, software tools, cybersecurity and blockchain. Each page credits the creator, writes out the full graphic and adds current figures where the original has dated. Readers most often start with the history of artificial intelligence timeline, a Vim cheat sheet for beginners, the Moore's law graph, humanoid robots compared by size or blockchain technology explained in six steps. Space technology sits in the science hub and video games in entertainment.
The graphic also covers four types of ETL, claimed business results, 17 tools and five steps to implement it.

This hand drawn mind map sets out computer science basics in six branches: computers, problem solving, programming, data, communication and the bigger picture.

Training compute doubled about every 21 months until 2010 and about every 6 months since, rising from Theseus in 1950 to GPT-4 and Gemini 1.0 Ultra in 2023.

Their combined market value rose from $1.1 trillion in 2012 to $17.6 trillion at the end of 2024, a 26% annual rate.

Median total compensation ranges from $231k at entry level to $1.45M for a principal engineer at Facebook.
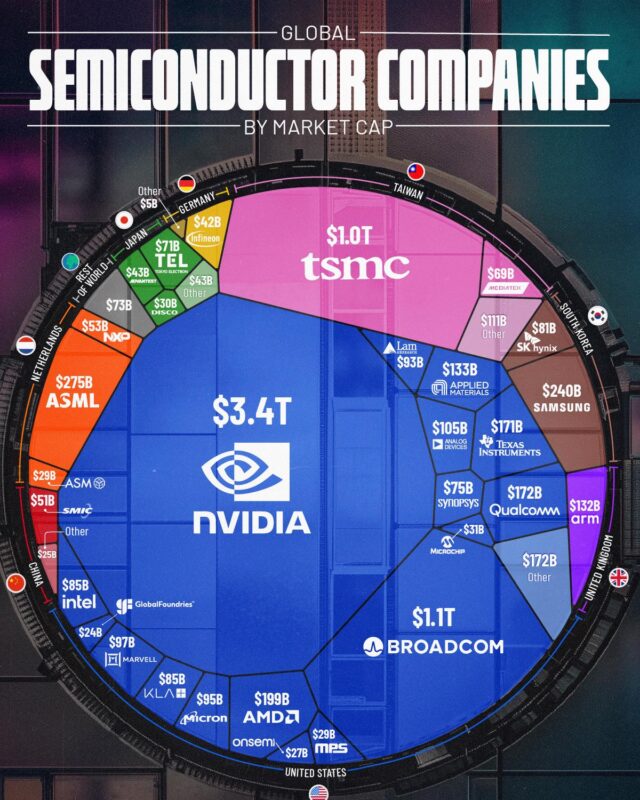
NVIDIA led at $3.4 trillion, followed by Broadcom at $1.1 trillion and TSMC at $1.0 trillion, then ASML and Samsung.

This Moore's law graph by Steve Jurvetson of Future Ventures, building on Ray Kurzweil's work, plots calculations per second per constant dollar from 1900…

Digital entertainment apps such as Netflix and Disney+ took $8.2 billion, ahead of dating apps at $5.7 billion and short video apps at $4.3 billion.
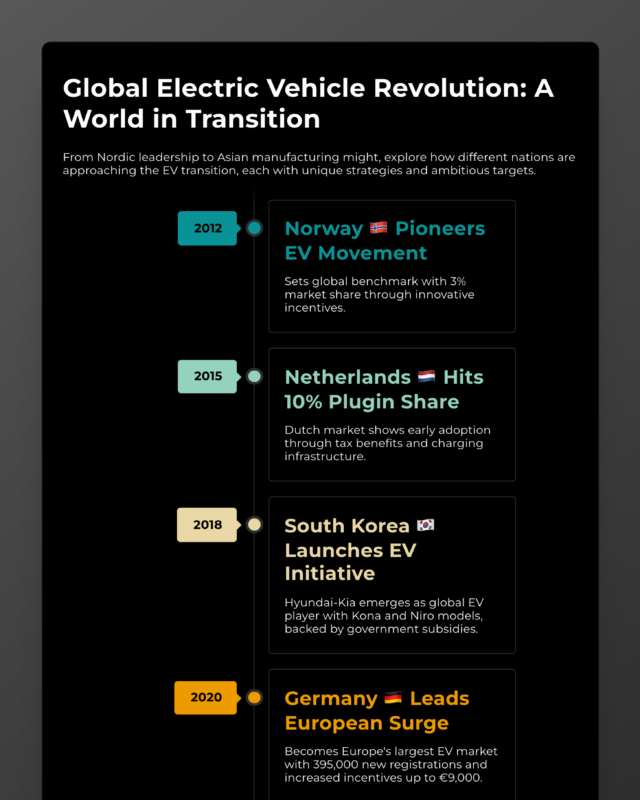
This StatPecker graphic is an electric vehicle history timeline for 2012 to 2023, with one milestone a year: Norway in 2012, the Netherlands in 2015, South…

Bitcoin accounted for $1,980 billion, about 54%, followed by other coins at $1,020 billion, Ethereum at $481 billion and stablecoins at $194 billion.

This cybersecurity threats infographic from CyberMaterial is a SOC guide to ten advanced attack techniques: DLL injection, heap spraying, privilege…

Software jobs grew from about 0.9 million to about 4.1 million, while hardware jobs fell from about 1.2 million to about 0.64 million and have been flat…
The 35 infographics here fall into a few groups. Artificial intelligence is covered through its history and the growth of training compute. Chips and computing power take in Moore's law, where semiconductors are made and which chip companies are worth most. Money in tech covers Apple's quarterly income, the Magnificent Seven stocks, software engineer pay, startup acquisitions and app spending. Practical references include a Vim cheat sheet, a computer science mind map, ETL and ten cyberattack techniques. There are also humanoid robots, best selling phones, Ethereum, data centers by country, e-waste, game and console prices, and invention timelines for sewing machines and Irish inventors.
For artificial intelligence, the History of Artificial Intelligence Timeline, 1943 to 2023 by Genuine Impact runs in 21 dated steps from a 1943 paper on artificial neurons to a 2023 lawsuit over AI image generators, and marks one AI winter starting in 1974. Pair it with the AI Training Compute Growth Chart, 1950 to 2025 by Charlie Giattino of Our World in Data, which shows training compute doubling about every 21 months until 2010 and about every 6 months since.
On chips, the Moore's Law Graph, 128 Years of Computing Power per Dollar by Steve Jurvetson of Future Ventures plots calculations per second per constant dollar from 1900 to the mid 2020s, with NVIDIA GPUs and custom AI chips now at the top. Trendline's Semiconductor Production by Country and Stage in 2021 shows the United States with 61% of chip design and Taiwan with 47% of fabrication.
MERPHI's Humanoid Robots 2024, 12 Notable Robots Compared by Size sets 12 machines against a 1.8 m human. 4NE-1 by Neura Robotics is the tallest and heaviest at 1.8 m and 80 kg, and Unitree's G1 the shortest at 1.3 m. For a working tool, the Vim Cheat Sheet for Beginners, the Commands You Need First by August R. Garcia of 256 Kilobytes fits 43 entries into nine sections, from exiting Vim to find and replace.
On the Visual Capitalist chart of the 15 best selling mobile phones, the Nokia 1100 is first with 250 million sold. The Nokia 1110 is second with 248 million and the iPhone 6/6 Plus third with 222 million.
NVIDIA, at $3.4 trillion on 30 December 2024, according to the Visual Capitalist (Voronoi) ranking. Broadcom ($1.1 trillion) and TSMC ($1.0 trillion) were the only other companies above $1 trillion.
The United States, with 5,388 as of December 2023, on the graphic made by Visual Capitalist for Global X ETFs. Germany (522) and the UK (517) rank second and third, ahead of China (449).
Give it a permanent page where people looking for your subject find it, with your name and a link to your site. Content marketers, agencies, designers and researchers all list here.