

Football
Premier League Club Revenues
Manchester City (€829.3m), Arsenal (€821.7m) and Manchester United (€793.1m) were close behind.
These infographics cover sport through its numbers, including records, player stats, team values and the cost of watching, with sections for the Olympics, football and the NFL. Each page credits the creator, gives the full table or chart as text and notes the season or date the figures come from. Popular pages include athlete participation at the 2024 Paris Olympics, Premier League squad values, NFL rushing leaders by decade, the most expensive MLB stadiums and an F1 lap time analysis of the Belgian Grand Prix.
Manchester City (€829.3m), Arsenal (€821.7m) and Manchester United (€793.1m) were close behind.
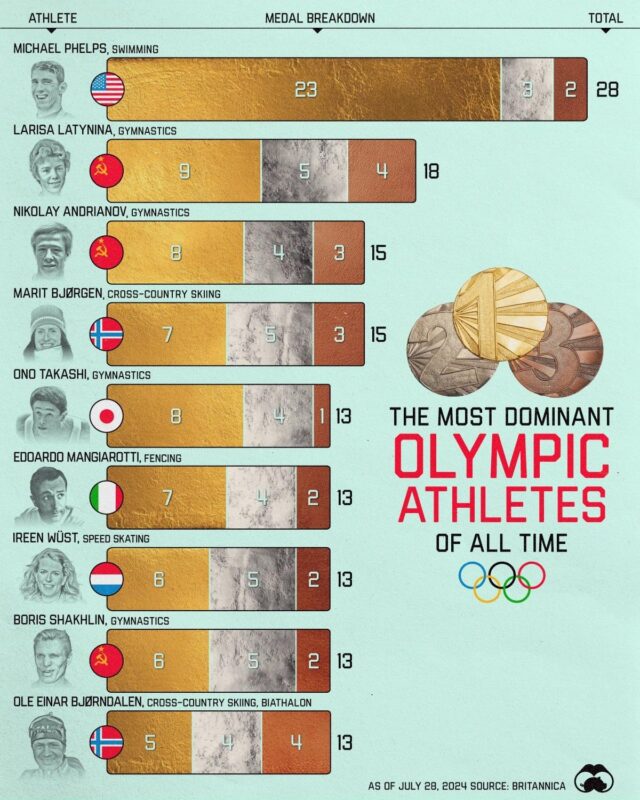
The American swimmer won 28 Olympic medals between 2004 and 2016, 23 of them gold, which is more than twice as many golds as anyone else.

Under IOC rules a gold medal must be at least 92.5% silver and plated with 6 grams of gold, the silver medal must be at least 92.5% silver and the bronze…
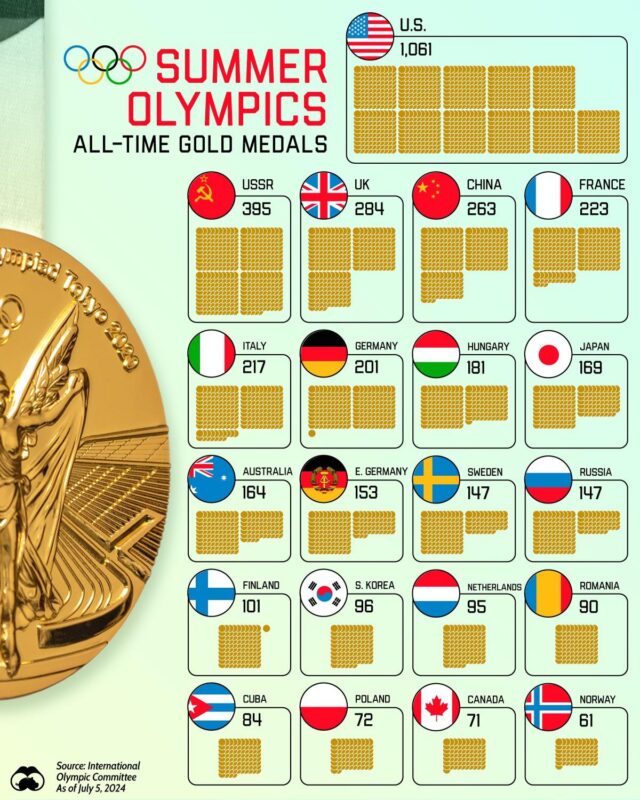
The Soviet Union is second on gold with 395, and China and Great Britain are level on 303 golds each.
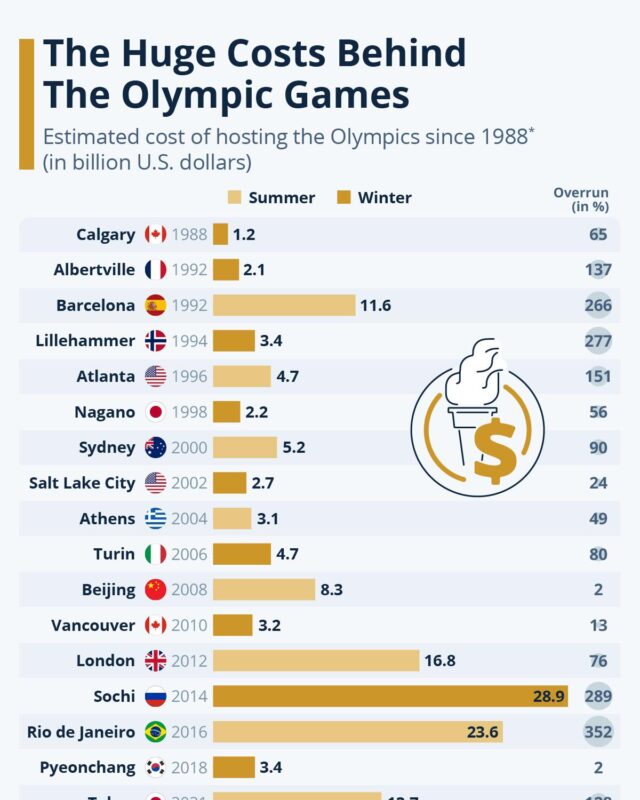
The Oxford Olympics Study 2024 puts the average Summer Games at US$8 billion and the average Winter Games at US$4.2 billion in 2022 dollars, before roads,…

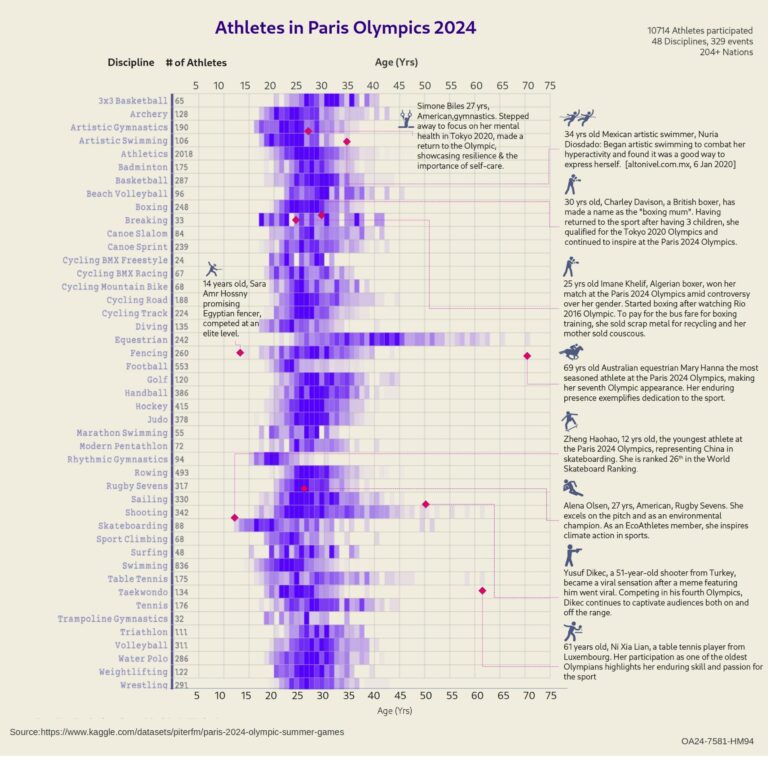
At Paris 2024 the oldest competitor was Australian dressage rider Mary Hanna, aged 69.

To compare players fairly, analysts convert them to per 90 minute rates and adjust for league strength.

Its best modern Summer Games was Paris 2024, with 64 medals (16 gold, 26 silver, 22 bronze) and fifth place in the medal table.

In 2024/25 PSG paid €535m in wages, according to figures released by the DNCG, French football's financial regulator.
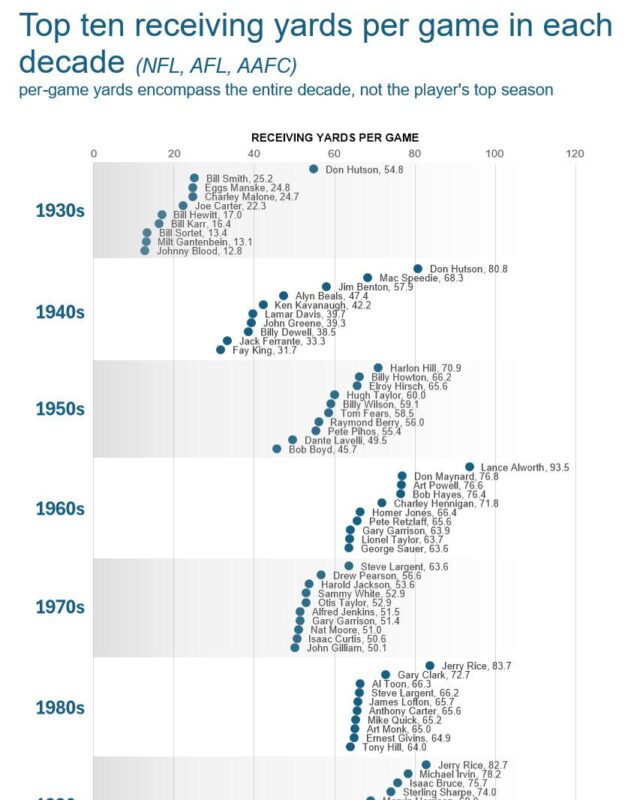
Jefferson's 96.5 yards a game from 2020 to 2024 is the highest decade figure on record, just ahead of Julio Jones's 96.2 in the 2010s.

He started 10 Super Bowls, won 7, threw for 3,039 yards and 21 touchdowns, and his 505 yards in Super Bowl LII is the single game record.

Of the 20 teams with the best regular season point differential since 1966, 13 reached the Super Bowl and 7 won it, while 4 lost their first playoff game.
The 38 infographics in this collection fall into a few clear groups. The largest covers the Olympics, with Paris 2024 athlete numbers and ages, all time medal tables, hosting costs, prize money, banned countries and what the medals are made of. The football pieces cover Premier League squad values, club revenue and expected goals, plus Ligue 1 wage bills. American sport is covered through NFL rushing, kicking and point differential, MLB ticket costs and exit velocity, and 30 years of NBA player stats. There are also charts on F1 lap times, chess openings, esports genres, push up progressions and the muscles used in cycling.
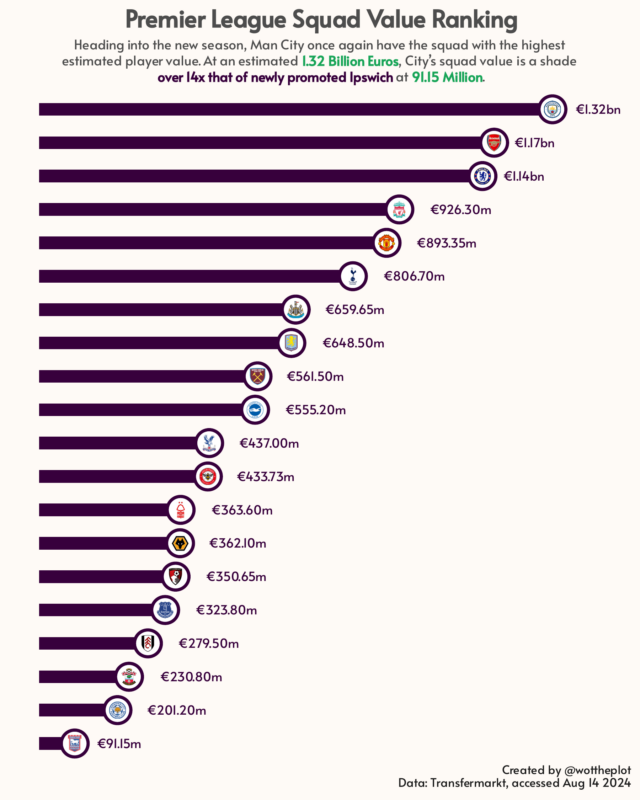
For football money, Premier League Squad Values Ranked for the 2024/25 Season by @wottheplot puts Manchester City top at an estimated €1.32 billion and newly promoted Ipswich Town last at €91.15 million, using Transfermarkt data from 14 August 2024. Chris Weatherspoon's Premier League Revenue by Club, First 31 Seasons for Game State covers a much longer period. It puts combined revenue at £71 billion, with Manchester United earning the most at £8,958.7m.
On the Olympics, Visual Capitalist's All Time Olympic Medals, Summer Games Gold Medals by Country counts 1,061 Summer Games golds for the US up to 5 July 2024, ahead of the Soviet Union on 395. The Statista chart Cost of Hosting Olympics Since 1988, With Budget Overruns shows Sochi 2014 as the most expensive Games at US$28.9 billion in 2022 dollars, and Rio 2016 running 352% over budget.
For American sport, u/JPAnalyst's NFL Rushing Leaders by Decade, Top Ten in Yards per Game ranks the top ten in yards per game for each decade, led by Eric Dickerson with 106.9 in the 1980s. Most Expensive MLB Stadiums to Attend a Game in 2023 from GamblingSites.com puts a day at a Boston Red Sox game at $396.16 in 2023, against a league average of $266.58.
The Football, NFL and Olympics sections hold more on each of those sports.
According to @wottheplot's chart, Manchester City had the most valuable squad before the 2024/25 season at an estimated €1.32 billion, ahead of Arsenal (€1.17bn) and Chelsea (€1.14bn). Newly promoted Ipswich Town were last at €91.15 million.
Statista's chart puts Sochi 2014 top at US$28.9 billion in 2022 dollars, followed by Rio de Janeiro 2016 at US$23.6 billion. Paris 2024 cost US$8.7 billion.
Compound Interest's graphic shows that a Paris 2024 gold medal weighs 529 grams but holds only 6 grams of gold. The rest is 505 grams of silver and 18 grams of iron.
Give it a permanent page where people looking for your subject find it, with your name and a link to your site. Content marketers, agencies, designers and researchers all list here.