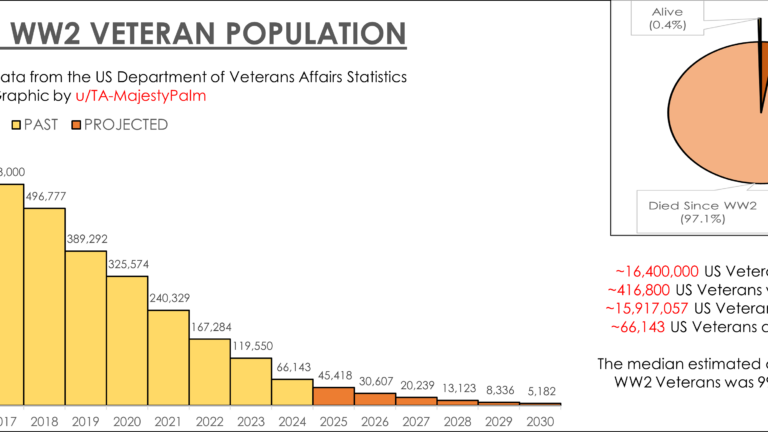
US World War 2 Veteran Population Statistics Today
Did you know that only 0.4% of the original 16 million Americans who served in World War II are still alive today? This striking reality
Did you know that only 0.4% of the original 16 million Americans who served in World War II are still alive today? This striking reality
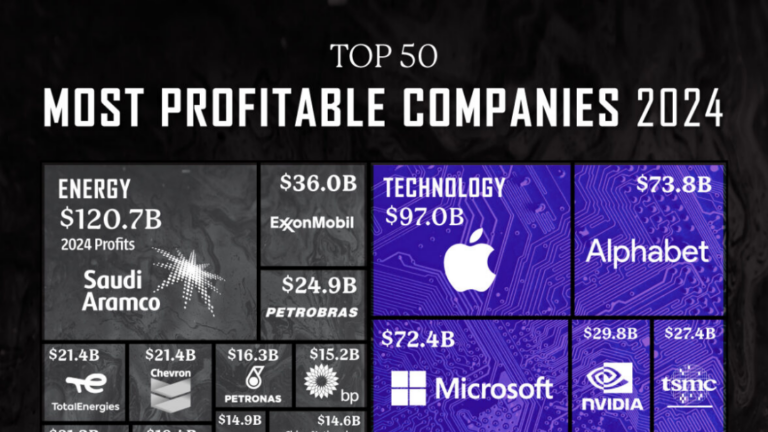
How do companies achieve staggering profits amid economic uncertainties? In 2024, the corporate giants defying all odds have been revealed, and the numbers speak volumes.
How do companies achieve staggering profits amid economic uncertainties? In
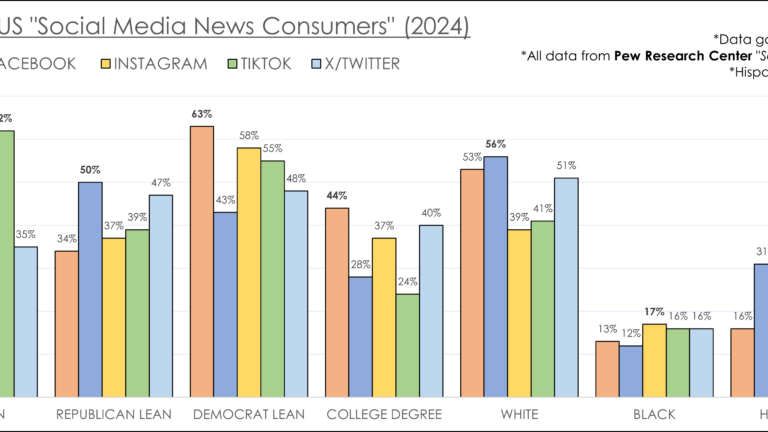
Did you know that as of 2024, nearly 5.17 billion
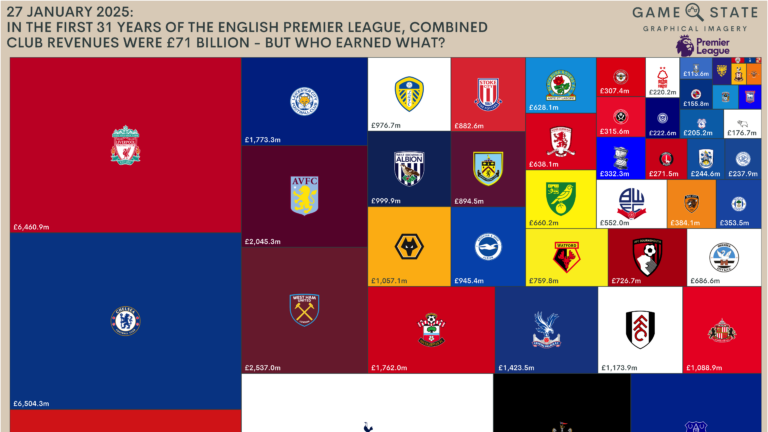
How do some football clubs consistently stay at the financial pinnacle while others struggle for revenue stability? The English Premier League (EPL) astounds the global
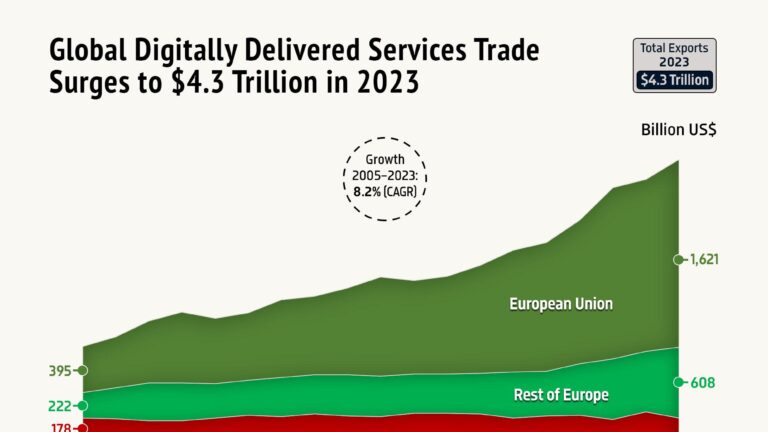
How did digital services become the dominant force in global trade? Since 2005, trade in digitally delivered services has skyrocketed, nearly quadrupling and capturing over
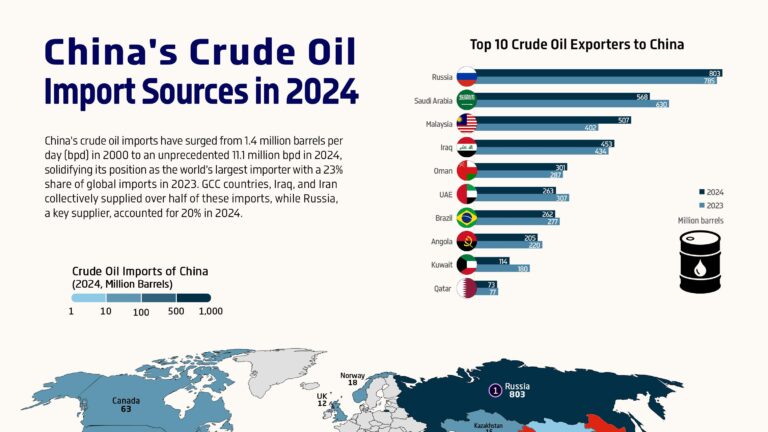
Is China's reliance on top crude oil suppliers shifting dramatically in 2024? As the dynamism of global energy markets continues to redefine alliances and dependencies,

The success of any infographic relies on the quality of information it offers. To make your infographic really stand out, you will need to do

If you are yet to integrate and take advantage of infographics in your marketing campaigns, then you are potentially missing out on a lot of

“A wealth of information creates a poverty of attention.” said, Herbert Simon Nobel Prize winner for Economics in 1978. The quote is indeed relevant for

Are you a content creator looking for a way to maximize web traffic? Infographics may be just the thing for you. Infographics, defined as ‘visual

Are you interested in improving your marketing skills? If yes, you must know how generating leads is one of the most important objectives of a

Let’s Define “Infographic” An Infographic is a Visual Representation of Information, Data, Or Knowledge. – Wikipedia The first modern infographic was made in 1861 –

Infographics are one of the best ways to visualize and explain data and information. However, since infographics mostly exist on the internet, there’s always a

Information is critical for businesses and as far as the internet is concerned, there’s no truer statement. Today, millions of small and medium enterprises are

Search engine optimization is one of the most sustainable digital marketing approaches for businesses. Infographics, on the other hand, are a stimulating method of presenting

Today, there is just too much information for internet users to look over let alone grasp. Many visual aids like videos and gifs make a

Wouldn’t it be awesome if developing infographics was as easy as writing a regular blog post? Unfortunately, developing visual content takes much more time, effort,

Today we are going to talk about how to create an infographic in Microsoft Word. As much as we advise against using Word to create