What are Africa’s main exports?
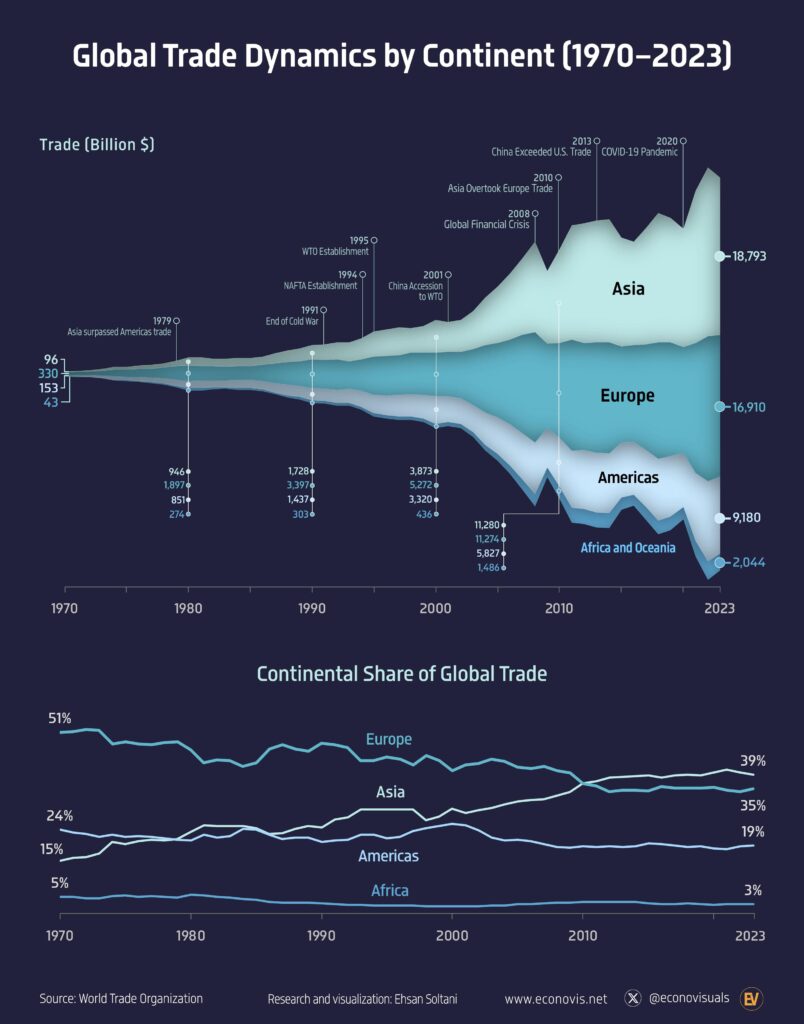
Africa’s main exports are fuels, metals and minerals. In 2023 fuels and related products, mostly crude oil and gas, earned $247 billion, precious metals and stones such as gold, platinum and diamonds $127 billion, and other minerals and metals $107 billion. Together that is about $480 billion, 68% of the continent’s exports of roughly $700 billion. Food and farm goods add another $84 billion.
Those figures come from Econovis, whose infographic tracks Africa’s exports by category from 2001 to 2023 using WTO and UN Comtrade data [1]. Counting agriculture and food as well, Econovis puts 80% of the continent’s 2023 exports in raw materials and commodities [2].
Africa’s exports by category
The table gives the value of each export category in 2001 and 2023, in billions of US dollars, with each category’s share and growth worked out from those values (our arithmetic from [1]).
| Category | 2001 | 2023 | Share in 2001 | Share in 2023 | Growth |
|---|---|---|---|---|---|
| Fuels and related products | $70bn | $247bn | 45% | 35% | 3.5 times |
| Precious metals and stones | $17bn | $127bn | 11% | 18% | 7.5 times |
| Other minerals and metals | $13bn | $107bn | 8% | 15% | 8.2 times |
| Agriculture and food | $19bn | $84bn | 12% | 12% | 4.4 times |
| Other manufactured goods | $27bn | $78bn | 17% | 11% | 2.9 times |
| Machinery and transport equipment | $10bn | $61bn | 6% | 9% | 6.1 times |
| Total | $156bn | $704bn | 100% | 100% | 4.5 times |
The six categories add up to $704 billion, which Econovis rounds to $700 billion [1]. Wikipedia’s summary of Africa’s economy uses an estimate of $720 billion for 2023 [3]. Different totals come from different country coverage and from how each source handles countries that report late, so treat the totals as close rather than exact.
How Africa’s exports have changed since 2001
Africa’s exports grew about four and a half times between 2001 and 2023, but the growth was not smooth. The value rose fast to 2008, fell sharply in the 2008 global financial crisis, recovered to a peak in the early 2010s, then slid when oil and commodity prices collapsed in the middle of the decade. It dipped again in 2020 with the COVID-19 pandemic, then jumped in 2021 and 2022 as commodity prices rose, before easing a little in 2023 [1].
Most of those swings come from fuels. Oil and gas prices move a long way from year to year, so the value of Africa’s fuel exports does too. Econovis makes the point that the dependence on commodities makes the value of Africa’s exports highly sensitive to global commodity prices [2].
The mix has shifted a little. Fuels are still the biggest category, but their share fell from about 45% to about 35%, while precious metals and stones and other minerals and metals grew fastest, together rising from about 19% to about 33% of exports. The share of manufactured goods other than machinery fell from about 17% to about 11%. Agriculture and food held steady at about 12% (our arithmetic from [1]).
Why Africa exports mostly raw materials
A large number of African economies rely on one or two commodities. UNCTAD’s Economic Development in Africa Report 2024 found that over half of African countries depend on oil, gas or minerals for at least 60% of their export earnings, and that the continent’s growth since 2000 has been closely tied to commodity price booms [4]. Wikipedia’s economic summary notes a 2024 report finding that 90% of Africa’s production exports were unprocessed goods [3].
That matters because raw materials are usually processed somewhere else. Crude oil leaves as crude and comes back as refined fuel, and ores are smelted and turned into components abroad, so most of the value is added outside Africa. UNCTAD also points to trade costs that are 50% above the global average because of gaps in transport, energy and communications, which make it harder for African firms to compete in manufacturing [4].
Main exports of African countries
The continent-wide figures hide big differences between countries. World Bank WITS data shows how varied they are:
- South Africa, one of the continent’s largest exporters, exported $110.6 billion of goods in 2023. Its biggest groups were stone and glass, which covers platinum, gold and diamonds, at 18%, minerals, mainly ores such as iron ore and manganese, at 15%, transport equipment, mainly vehicles, at 12%, and metals at 11%. Fuels, mostly coal, were 11% [5].
- Angola is the opposite case. Of its $51.3 billion of goods exports in 2022, fuels made up 92.8% [6].
- Morocco has one of the most varied export mixes. Of its $42.2 billion of exports in 2022, chemicals, a group that includes its phosphate fertilisers, were 24.6% and transport equipment, mainly cars and parts, 18.2% [7].
Oil and gas exporters such as Nigeria, Algeria, Libya and Angola make up much of the fuels category, while South Africa, Ghana, Botswana and the Democratic Republic of the Congo supply much of the gold, diamonds, platinum, copper and cobalt.
Where Africa’s exports go
World Bank WITS figures for sub-Saharan Africa give a picture of the main buyers. In 2023 the region exported $393 billion of goods. China took 17.2%, the Netherlands 5.8%, India 5.6%, the United States 4.6% and South Africa 4.2%. By region, 29.2% went to Europe and Central Asia, 27.4% to East Asia and the Pacific, and 20.9% to other sub-Saharan African countries [8].
The same data shows fuels made up 35.6% of the region’s exports and raw materials as a whole 48.3%, much the same picture as the continent-wide figures [9].
Trade within Africa
About a fifth of sub-Saharan Africa’s exports go to other African countries [8]. The African Continental Free Trade Area, which began trading on 1 January 2021, is meant to change that by removing tariffs on most goods traded between members [10]. Under the agreement members are to remove tariffs on 90% of goods, and each country can exclude 3% [10]. In 2018 the UN Economic Commission for Africa estimated the agreement would raise intra-African trade by 52% [10]. UNCTAD sees regional trade as one of the main ways to cut Africa’s dependence on commodity markets abroad [4].
Questions about Africa’s main exports
What is Africa’s biggest export?
Fuels: crude oil, natural gas and refined products. They earned $247 billion in 2023, about 35% of Africa’s exports [1].
What products are exported from Africa?
Mainly crude oil and gas, gold, platinum and diamonds, metal ores such as copper, cobalt, iron ore and manganese, and farm goods such as cocoa, coffee, tea, fruit and nuts. Manufactured exports include vehicles from South Africa and Morocco [1][5][7].
How much does Africa export each year?
About $700 billion in goods in 2023, on Econovis’s figures, up from $156 billion in 2001 [1]. Other sources put 2023 a little higher, at about $720 billion [3].
Who buys the most from Africa?
China is the largest single buyer, taking 17.2% of sub-Saharan Africa’s goods exports in 2023. Europe as a whole takes a larger share, and other African countries take about a fifth [8].
Why is Africa so dependent on commodity exports?
Most African economies built their export sectors around oil, gas, minerals and cash crops, and many have struggled to grow manufacturing because of high trade and energy costs. Over half of African countries rely on oil, gas or minerals for at least 60% of their export earnings [4].
Sources
- Econovis, Evolution of Africa’s Export Composition (2001 to 2023), 4 January 2025, from WTO and UN Comtrade data. This is the original post for the infographic.
- Econovis, Raw Materials and Commodities Dominate Africa’s Exports, 9 January 2025.
- Wikipedia, Economy of Africa.
- UNCTAD, Economic Development in Africa Report 2024.
- World Bank WITS, South Africa exports by product group, 2023.
- World Bank WITS, Angola exports by product group, 2022.
- World Bank WITS, Morocco exports by product group, 2022.
- World Bank WITS, Sub-Saharan Africa exports by partner, 2023.
- World Bank WITS, Sub-Saharan Africa exports by product group, 2023.
- Wikipedia, African Continental Free Trade Area.
Last reviewed 12 November 2026