Key points
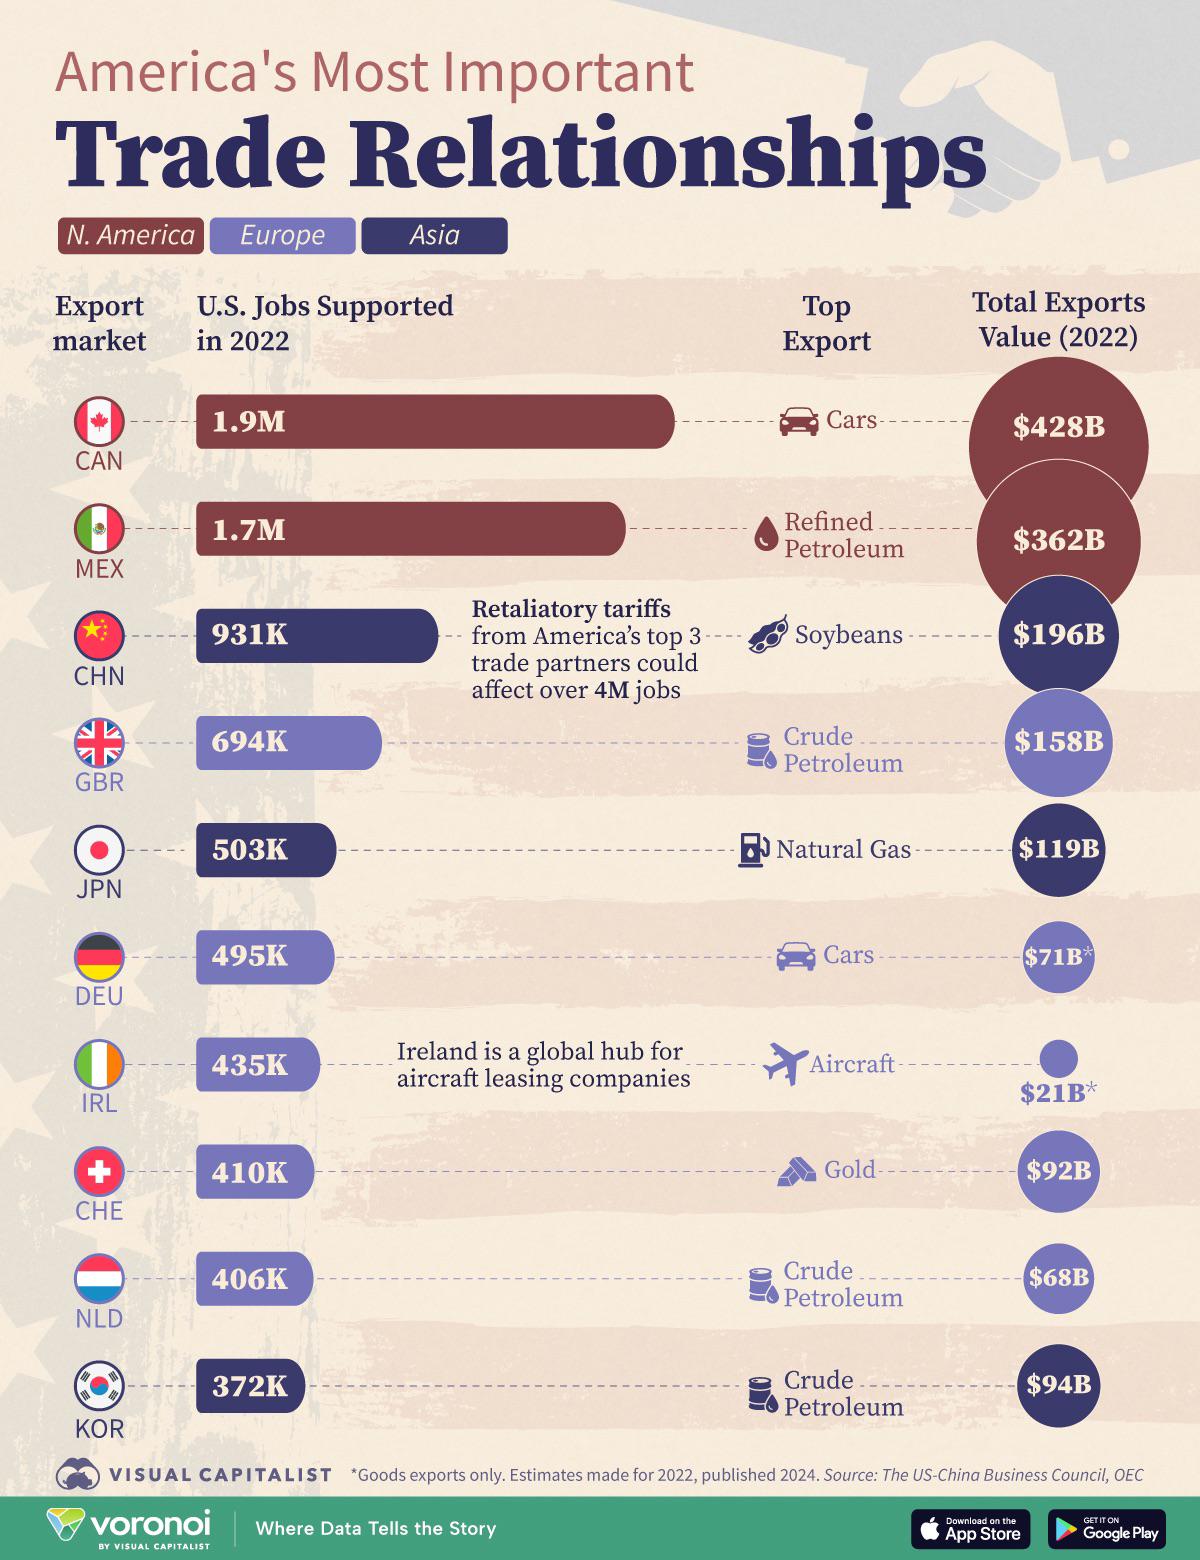
- Canada and Mexico lead the chart. US exports to Canada supported 1.9 million US jobs in 2022, and exports to Mexico 1.7 million.
- China is third, with 931,000 jobs. Soybeans are the top US export there, the only market on the chart where a farm product leads.
- Exports to Canada, Mexico and China together supported more than 4 million US jobs, the figure in the graphic’s main callout [1].
- Crude oil, refined petroleum or natural gas is the top export to five of the ten markets: Mexico, the UK, Japan, the Netherlands and South Korea.
- Five of the ten markets are in Europe, but none supports more than the 694,000 jobs linked to exports to the UK.
America’s most important trade relationships in text
Title: America’s Most Important Trade Relationships. Each row shows an export market, a bar for the US jobs supported in 2022, the top US export to that market and a circle sized by total export value in 2022. Colour shows the region: North America, Europe or Asia.
| Export market | Region | US jobs supported in 2022 | Top export | Total exports value (2022) |
|---|---|---|---|---|
| Canada | North America | 1.9M | Cars | $428B |
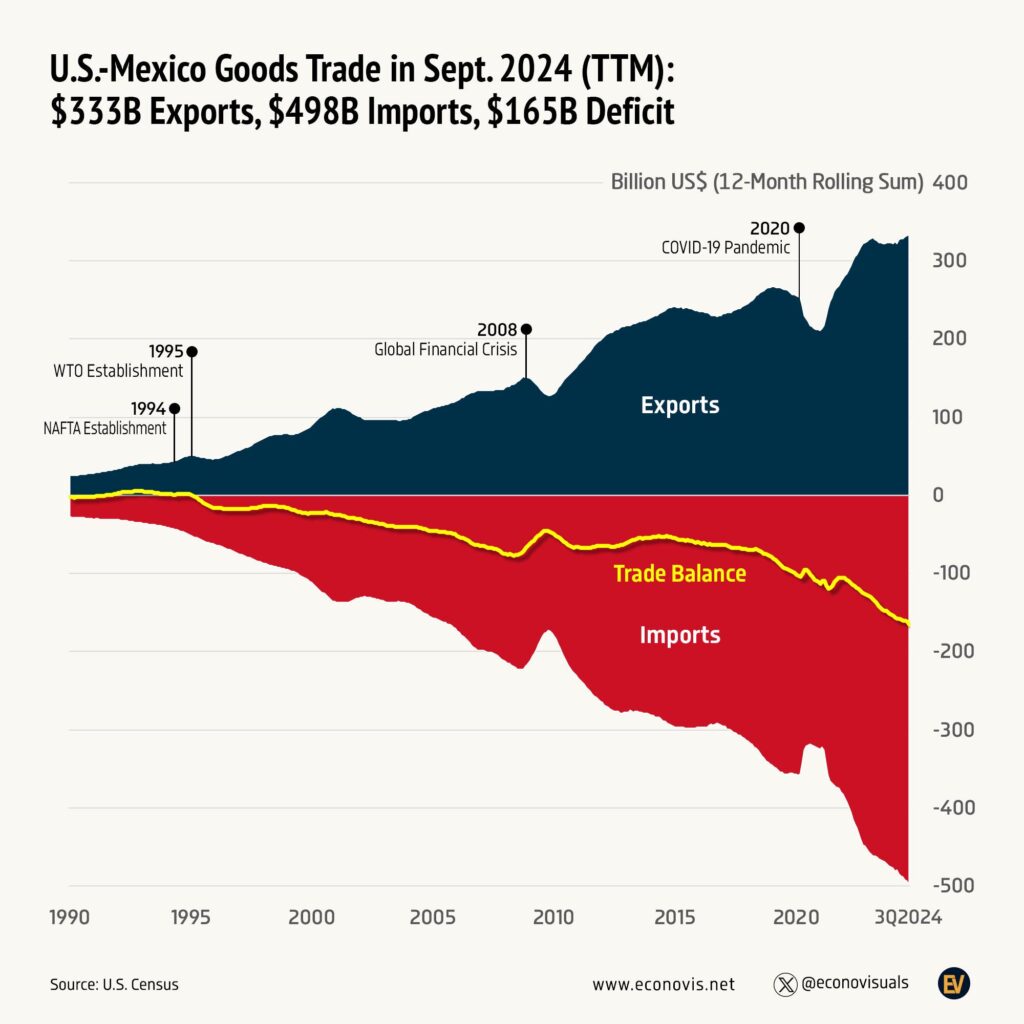
| Mexico | North America | 1.7M | Refined petroleum | $362B |
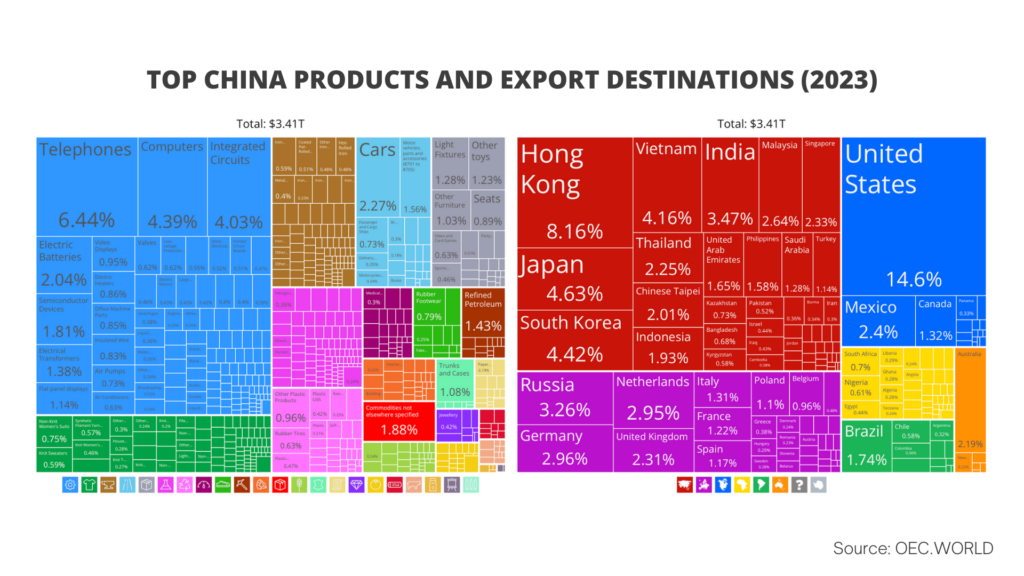
| China | Asia | 931K | Soybeans | $196B |
| United Kingdom | Europe | 694K | Crude petroleum | $158B |
| Japan | Asia | 503K | Natural gas | $119B |
| Germany | Europe | 495K | Cars | $71B* |
| Ireland | Europe | 435K | Aircraft | $21B* |
| Switzerland | Europe | 410K | Gold | $92B |
| Netherlands | Europe | 406K | Crude petroleum | $68B |
| South Korea | Asia | 372K | Crude petroleum | $94B |
Callout next to China: “Retaliatory tariffs from America’s top 3 trade partners could affect over 4M jobs.” Callout next to Ireland: “Ireland is a global hub for aircraft leasing companies.” Footnote: goods exports only, estimates made for 2022 and published in 2024. The asterisk marks two values (Germany and Ireland). Source: The US-China Business Council, OEC. Branding: Visual Capitalist, and voronoi by Visual Capitalist.
What the jobs figures measure
The job numbers are estimates of US employment supported by goods exports to each market. They are not counts of people employed by exporting firms. Visual Capitalist says the estimates were made for 2022 by The US-China Business Council in a report published in 2024 [1]. The ranking by jobs does not follow export value exactly. Ireland, for example, is linked to 435,000 jobs on $21 billion of exports, while Switzerland is linked to 410,000 jobs on $92 billion.
Visual Capitalist published a related chart on the US exports to China that support the most jobs, which treats China separately [2].
Checking the export values against Census data
The export values on the graphic come from OEC, the Observatory of Economic Complexity, according to its source line. The US Census Bureau publishes official totals for US goods exports to each country. For 2022 they are lower than the graphic’s values for eight of the ten markets, and less than half the graphic’s figure for the UK and Switzerland. Germany and the Netherlands are slightly higher in the Census data:
| Market | Graphic (OEC) | US Census Bureau, 2022 goods exports |
|---|---|---|
| Canada | $428B | $359.1B |
| Mexico | $362B | $327.0B |
| China | $196B | $154.0B |
| United Kingdom | $158B | $76.8B |
| Japan | $119B | $80.2B |
| Germany | $71B* | $72.9B |
| Ireland | $21B* | $15.9B |
| Switzerland | $92B | $36.7B |
| Netherlands | $68B | $72.9B |
| South Korea | $94B | $72.0B |
Census figures are in nominal US dollars, not seasonally adjusted [3]. We have not been able to trace why the OEC values on the graphic differ by this much. Different trade datasets use different methods, so the graphic’s dollar values should not be read as official US export statistics. The ranking by jobs is not affected, because the jobs estimates come from the separate US-China Business Council report.
Notes on this infographic
- The graphic’s export values differ from US Census Bureau goods export totals for 2022, by more than half for the UK and Switzerland (see the table above) [3].
- The asterisks on the Germany and Ireland values are not explained on the graphic.
- The figures cover goods only. Services exports, which the graphic does not include, matter a great deal for some markets, for example aircraft leasing in Ireland as the callout notes.
- The callout about retaliatory tariffs is the publisher’s framing. It refers to the jobs total for exports to all three countries, not to an estimate of jobs that would be lost.
Questions about US trade relationships
What are normal trade relations?
Permanent normal trade relations (PNTR) is a US legal designation for free trade with a foreign state. It replaced the older term most favoured nation (MFN) under a 1998 law [4]. MFN status means a country receives the same trade advantages, such as low tariffs, as any other country with that status [4].
What is the largest export market for the United States?
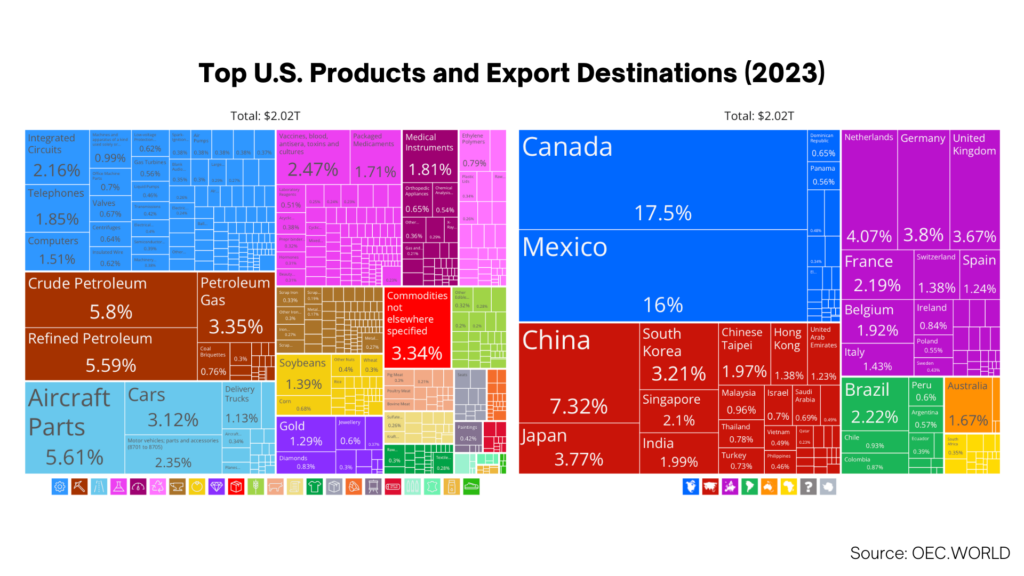
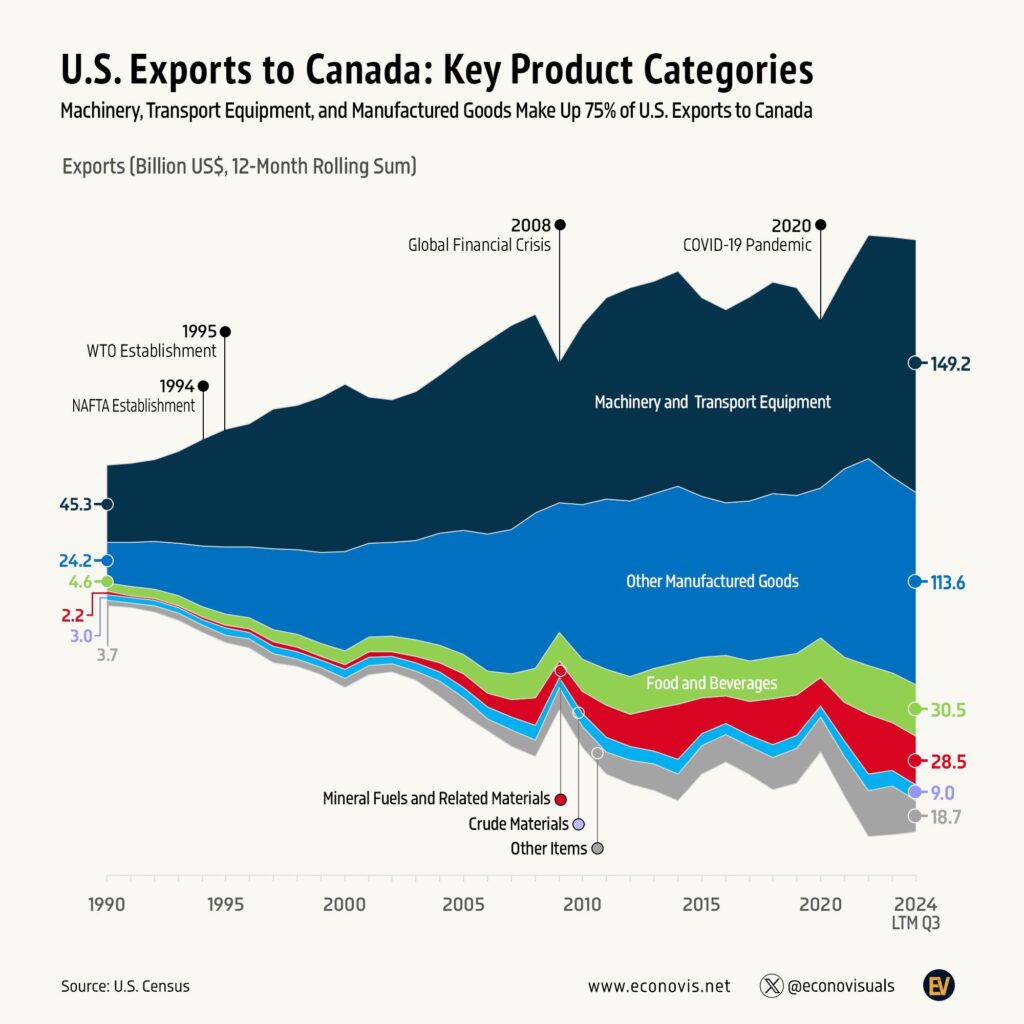
Canada is the largest market for US goods exports, at $428B in 2022 on the graphic and $359.1B in US Census Bureau data [3]. Exports to Canada supported 1.9 million US jobs in 2022, and cars are the top US export there. Mexico is second, with $362B of exports on the graphic and 1.7 million jobs.
How many US jobs depend on exports to China?
US exports to China supported 931,000 jobs in 2022, the third highest of the ten markets after Canada and Mexico. Soybeans are the top US export to China, the only market on the chart where a farm product leads. Exports to Canada, Mexico and China together supported more than 4 million US jobs [1].
How are jobs supported by US exports estimated?
The job figures are estimates of US employment supported by goods exports to each market, not counts of people employed by exporting firms. Visual Capitalist says The US-China Business Council made the estimates for 2022 in a report published in 2024 [1]. The ranking does not follow export value exactly, as Ireland is linked to 435,000 jobs on $21 billion of exports and Switzerland to 410,000 jobs on $92 billion.
Sources
- Visual Capitalist on Voronoi, Exports to Canada, Mexico, and China Support Over 4 Million U.S. Jobs, 17 December 2024. The creator’s original post of this graphic.
- Visual Capitalist, Ranked, America’s Top Exports to China by the Jobs They Support, January 2025.
- US Census Bureau, Trade in Goods by country, 2022 totals: Canada, Mexico, China, United Kingdom, Japan, Germany, Ireland, Switzerland, Netherlands, South Korea.
- Wikipedia, Permanent normal trade relations.
Last reviewed 30 October 2026