Ever wonder which state has the longest average emergency room visit times?
This question is not just a matter of curiosity but can also have significant implications for patient care and healthcare resource allocation.
In this article, we uncover the average emergency room visit times across different states and provide insight into the factors affecting these times.
Did you know that while the national average is approximately 2 hours and 44 minutes, Washington, D.C. tops the chart at a staggering 5.5 hours?
The surprising disparities in wait times highlight the pressing need to understand the dynamics at play in each state. Whether it’s regional healthcare resources, patient volume, or external influences like the pandemic, each factor paints a critical part of the larger picture.
Read on to see how your state compares!
Average Emergency Room Visit Times Across the U.S.
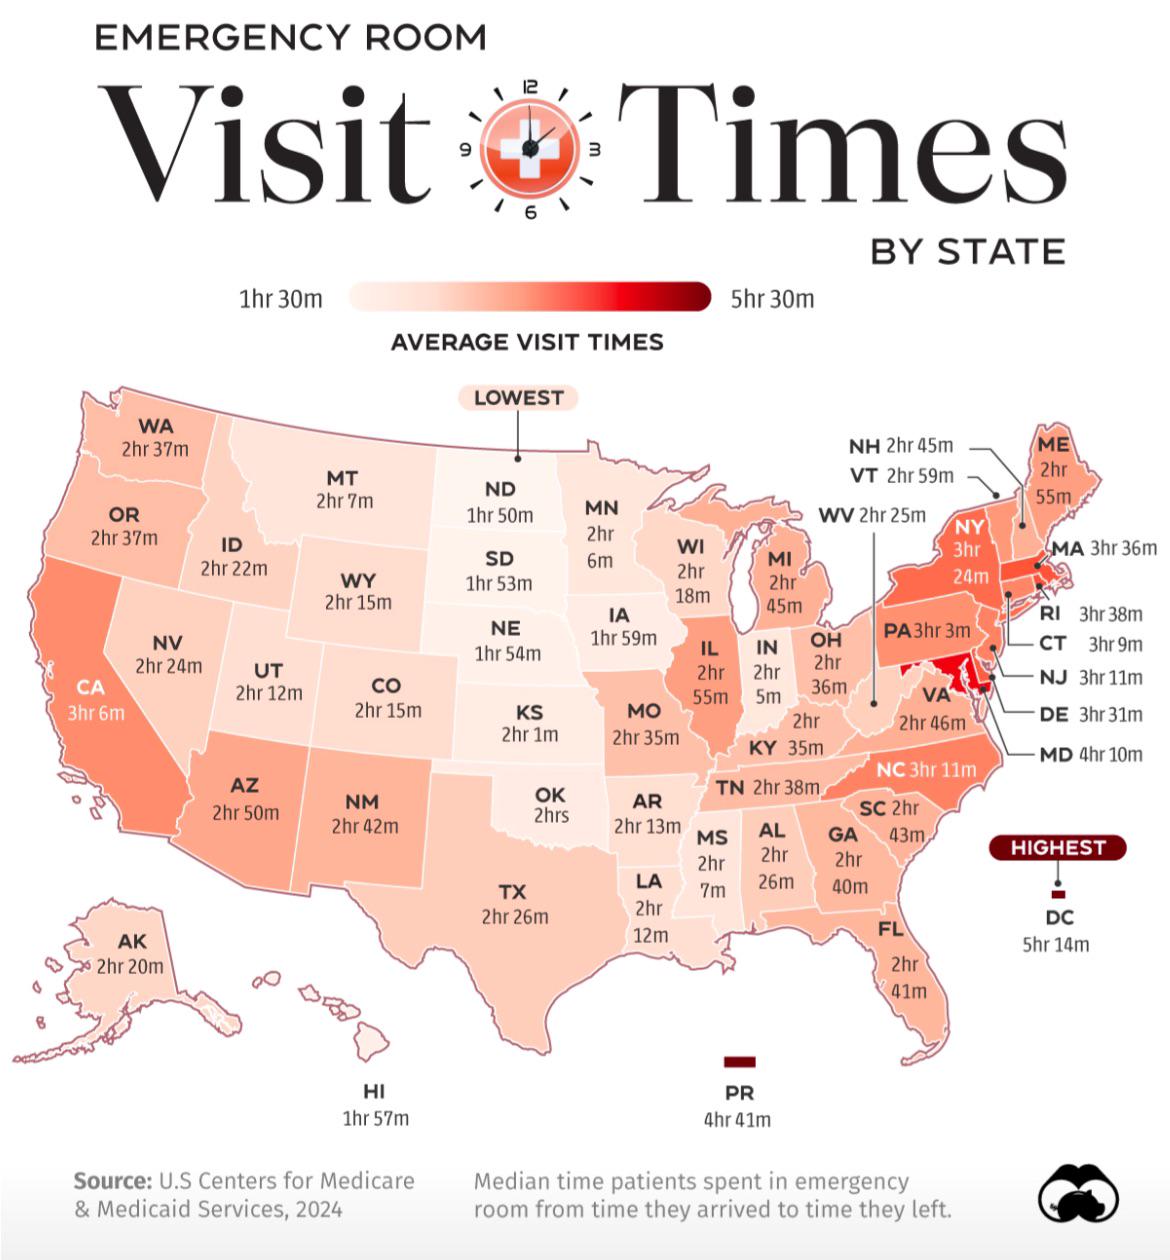
The average emergency room (ER) wait time in the U.S. is approximately 2 hours and 44 minutes. However, this figure can vary significantly from state to state due to various factors such as patient volume, regional healthcare resources, and external influences like the COVID-19 pandemic. Washington, D.C. stands out with the longest average wait time of 5.5 hours, highlighting the capital's challenges in managing patient flow and resource allocation. Conversely, North Dakota boasts the shortest wait time at only 108 minutes, suggesting more efficient healthcare management or lower patient influx.
Examining state-by-state ER wait times reveals a diverse landscape of healthcare efficiency across the nation. States like Maryland, Rhode Island, Massachusetts, and Delaware also report lengthy wait times, reflecting regional challenges in healthcare delivery. On the other end of the spectrum, states such as Washington and Oregon maintain shorter average wait times around 2 hours and 37 minutes, indicating better handling of patient demand or more effective healthcare systems. Understanding these disparities is crucial for patients seeking timely care and for policymakers aiming to improve emergency room services across the country.
| State | Average Wait Time |
|---|---|
| Washington, D.C. | 5.5 hours |
| Maryland | 4.2 hours |
| Rhode Island | 4.1 hours |
| Massachusetts | 4.0 hours |
| Delaware | 3.9 hours |
| North Dakota | 108 minutes |
| Washington | 2.6 hours |
| Oregon | 2.6 hours |
| South Dakota | 2.7 hours |
| Nebraska | 2.8 hours |
Factors Affecting ER Wait Times by State
What primarily affects ER wait times? High patient volume is a critical factor. Emergency departments often face overwhelming numbers of patients, especially during peak hours, which can lead to significant delays. The influx of patients varies by region, with urban areas typically experiencing higher volumes due to larger populations. Additionally, seasonal illnesses and local health crises can further strain resources, contributing to longer wait times.
How does healthcare infrastructure influence wait times? The availability and quality of healthcare infrastructure play a pivotal role. States with well-equipped hospitals and sufficient staffing tend to manage ER wait times more effectively. Conversely, regions with limited healthcare facilities or fewer medical professionals struggle to meet demand, resulting in hospital ER delays. The presence of alternative healthcare options, such as urgent care centers, can help alleviate pressure on emergency departments by redirecting non-critical cases.
What impact has the pandemic had on ER wait times? The COVID-19 pandemic has significantly exacerbated delays in emergency rooms. Hospitals have faced increased demand for services due to the virus, while simultaneously dealing with staff shortages and resource constraints. This has strained healthcare system performance across the country. During the pandemic, many ERs have implemented changes to prioritize critical cases, but the overall impact remains substantial, affecting both patient care and wait times.
- High patient volume
- Limited healthcare infrastructure
- Lack of alternative care options
- Regional drug problems
- Staff shortages
State Comparisons: Longest and Shortest ER Wait Times
Which state has the longest average ER wait time? Washington, D.C. holds this distinction with an average wait time of 5.5 hours. This prolonged wait period highlights significant challenges in managing patient flow and resource allocation within the capital's healthcare system. Other states experiencing extended ER delays include Maryland, Rhode Island, Massachusetts, and Delaware, where healthcare infrastructure struggles to keep pace with patient demand.
Where can patients expect the shortest ER wait times? North Dakota offers the quickest service, with an average of just 108 minutes. This efficiency may be attributed to a combination of factors such as lower patient volume and effective healthcare management. States like Washington and Oregon also report relatively shorter wait times, averaging around 2 hours and 37 minutes, indicating a more streamlined approach to emergency care.
| State | Wait Time |
|---|---|
| Washington, D.C. | 5.5 hours |
| Maryland | 4.2 hours |
| Rhode Island | 4.1 hours |
| Massachusetts | 4.0 hours |
| Delaware | 3.9 hours |
| North Dakota | 108 minutes |
| Washington | 2.6 hours |
| Oregon | 2.6 hours |
| South Dakota | 2.7 hours |
| Nebraska | 2.8 hours |
Strategies for Reducing ER Wait Times
How can hospitals effectively reduce ER wait times? One successful strategy is improving patient flow, which involves optimizing the movement of patients through the emergency department. Hospitals achieve this by reorganizing triage processes and ensuring that patients are seen by the right specialists quickly. Another approach is enhancing staff efficiency, which can be done by providing additional training and resources to medical teams, allowing them to perform their duties more effectively and respond to patient needs promptly.
What innovations are hospitals adopting to manage ER wait times? Leveraging technology is becoming increasingly popular. Electronic health records (EHR) and automated patient tracking systems help streamline administrative tasks, allowing staff to focus more on patient care. Additionally, some hospitals have implemented fast-track systems. These systems prioritize less critical cases, enabling them to be processed more quickly, which alleviates congestion in the ER and reduces overall wait times.
- Optimize patient flow
- Enhance staff efficiency
- Leverage technology
- Implement fast-track systems
Impacts of Long ER Wait Times on Patient Care
What are the effects of long ER wait times on patient health? Delayed treatment is a direct consequence, as patients endure prolonged periods before receiving necessary medical attention. This delay can exacerbate medical conditions, leading to more severe health outcomes. In critical cases, such as heart attacks or strokes, every minute counts, and extended wait times can significantly affect recovery prospects and overall survival rates.
How do long wait times affect patient satisfaction? Increased dissatisfaction is a common outcome. Prolonged waits in emergency rooms can lead to frustration and anxiety, negatively impacting the overall patient experience. This dissatisfaction can deter individuals from seeking future care in hospital settings, potentially compromising their health further. Additionally, the trust in healthcare systems may diminish, as patients may perceive extended waits as a sign of inefficiency or poor healthcare quality by state.
- Delayed treatment leading to worsened health conditions
- Increased patient dissatisfaction and anxiety
- Erosion of trust in healthcare systems
Visualizing Emergency Room Wait Times: Tools and Resources
How can visual aids enhance understanding of ER wait times? Data visualizations are invaluable in providing clear insights into emergency room wait times and the efficiency of healthcare services. By employing maps and charts, these tools help both patients and policymakers identify regional disparities in healthcare accessibility. This visual representation simplifies complex data, making it accessible and understandable, which is crucial for informed decision-making and effective resource allocation. Such visual tools also allow for the assessment of state hospital infrastructure, highlighting areas in need of improvement or investment.
- Healthcare Map: Offers an interactive overview of ER wait times by state.
- ER Dashboard: Tracks real-time wait times and hospital performance metrics.
- Regional Healthcare Analysis Tool: Provides detailed reports on healthcare accessibility and infrastructure.
Final Words
Understanding the average emergency room visit times by state sheds light on the varying dynamics of healthcare efficiency across the nation.
From Washington, D.C.'s prolonged waits to North Dakota's more efficient service, comprehending these differences provides context to the challenges affecting patient care.
Factors like patient volume and healthcare infrastructure play significant roles, compounded by recent global health crises.
These insights emphasize the crucial need for innovative strategies to reduce ER wait times, improve patient experiences, and enhance healthcare quality.
Visualizing this data through infographics can guide policymakers toward optimized resource allocation, fostering a stronger, more reliable healthcare system for everyone.

