Why do some states have higher average IQs than others?
The linkage between geography and intelligence is both fascinating and contentious. In our deep dive into the average IQ by state in the USA, we uncover significant disparities that raise intriguing questions about education, socioeconomic factors, and regional differences.
Using data from the Program for the International Assessment of Adult Competency (PIAAC) and the National Assessment of Educational Progress (NAEP), this article reveals the 2022 average IQ scores across all states.
Is your state smarter than its neighbors?
Overview of Average IQ by State in the USA
The U.S. national average IQ is reported to be 98, a figure that serves as a benchmark for understanding cognitive abilities across the country. This average is derived from extensive data collection and analysis, providing a snapshot of national intellectual performance.
Significant disparities exist between states, highlighting regional differences in average IQ scores. These scores are derived from the Program for the International Assessment of Adult Competency (PIAAC) and the National Assessment of Educational Progress (NAEP). The data set, from the year 2022, reflects both educational and socio-economic factors that contribute to these differences.
| State | Average IQ Score |
|---|---|
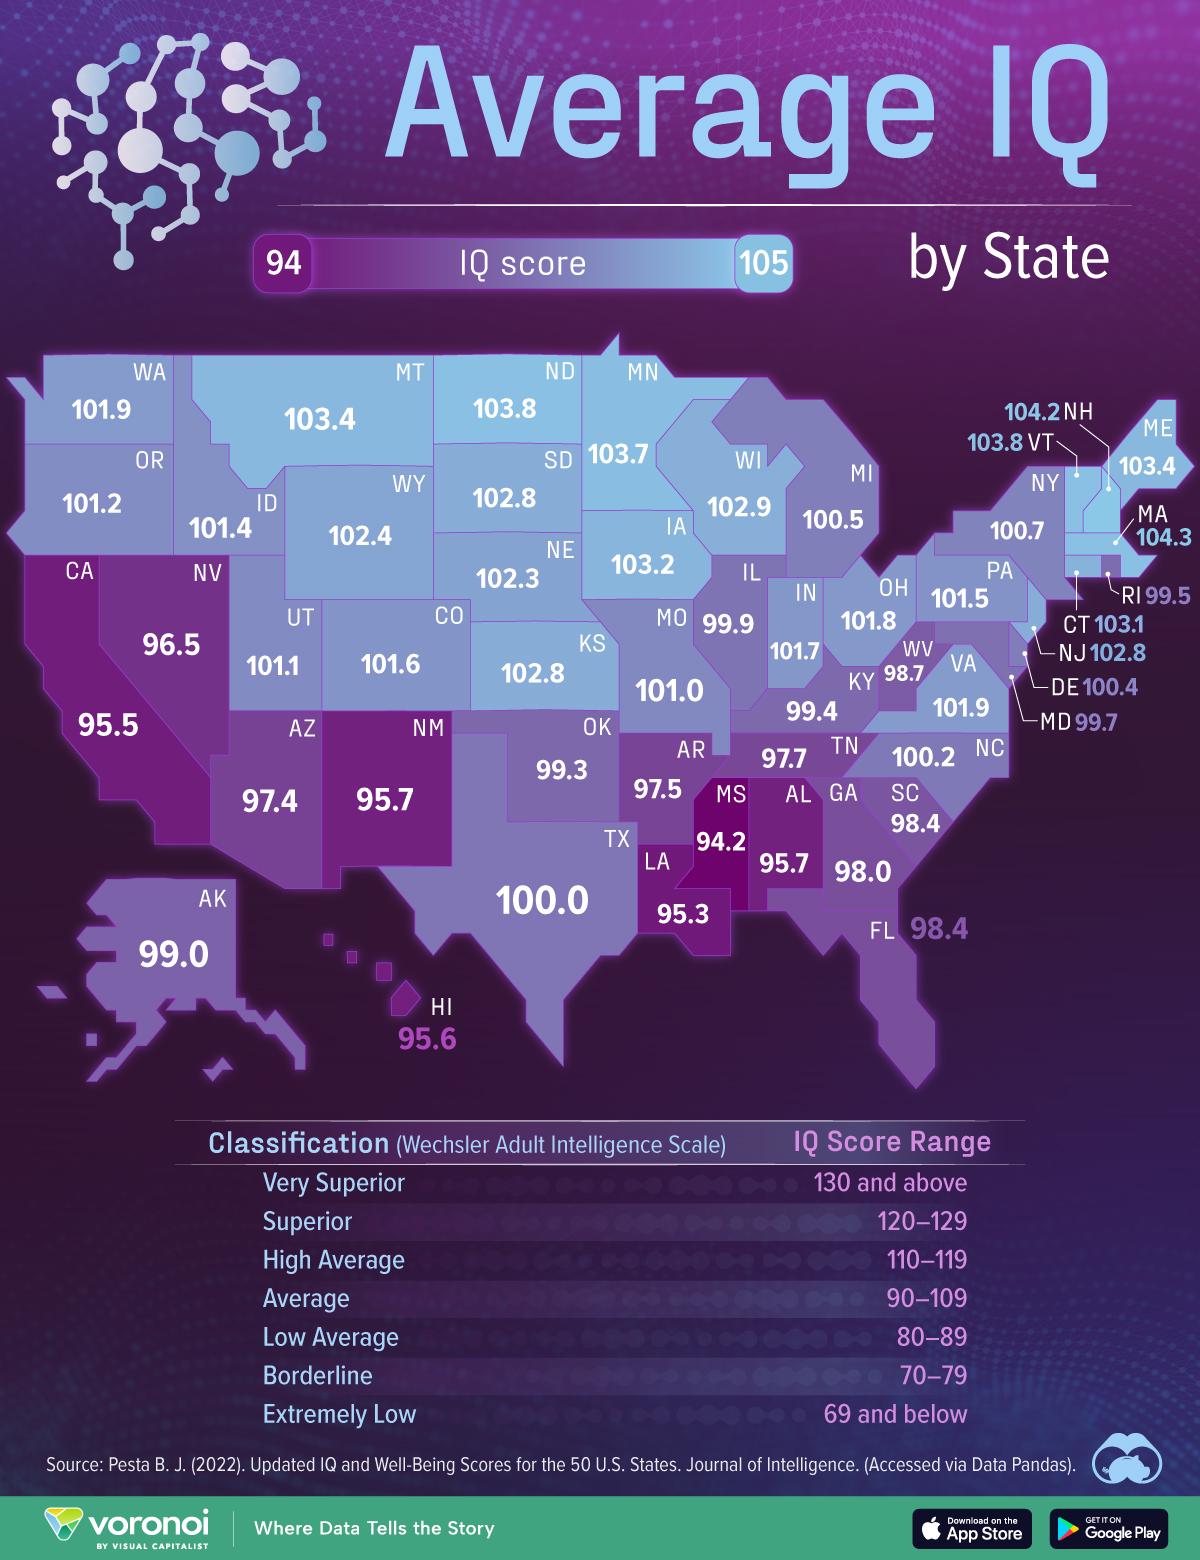
| Massachusetts | 104.3 |
| New Hampshire | 104.2 |
| Vermont | 103.8 |
| North Dakota | 103.4 |
| Minnesota | 103.3 |
| Mississippi | 94.2 |
| Louisiana | 95.3 |
| California | 95.5 |
| Hawaii | 95.6 |
| New Mexico | 95.7 |
Key takeaways include the wide range of scores, from Massachusetts at the top with an average IQ of 104.3, to Mississippi at the bottom with an average IQ of 94.2. These differences underscore the importance of regional educational policies and socio-economic conditions in shaping cognitive abilities.
High and Low IQ States: A Detailed Look
Examining the states with the highest average IQ scores reveals interesting insights into regional cognitive abilities. The top five states with the highest average IQ scores are:
- Massachusetts: 104.3
- New Hampshire: 104.2
- Vermont: 103.8
- North Dakota: 103.4
- Minnesota: 103.3
These states consistently show strong educational systems and socio-economic stability, which contribute to higher cognitive performance. Massachusetts leads the pack with an average IQ of 104.3, closely followed by New Hampshire and Vermont.
Conversely, states with the lowest average IQ scores present a different picture, often influenced by various socio-economic challenges. The bottom five states with the lowest average IQ scores are:
- Mississippi: 94.2
- Louisiana: 95.3
- California: 95.5
- Hawaii: 95.6
- New Mexico: 95.7
Mississippi, with an average IQ of 94.2, is the lowest among the states. Factors such as lower educational attainment levels and economic disparities play a significant role in shaping these outcomes. Understanding these differences is crucial for addressing educational and policy needs tailored to each state's specific challenges.
Factors Affecting IQ Scores by State
IQ tests are not perfect measures of skills and abilities. They provide a snapshot of cognitive functioning but fail to capture the full spectrum of human intelligence. Limitations include cultural biases, test anxiety, and the narrow focus on specific cognitive skills. These factors can skew results and may not accurately reflect an individual's true intellectual capabilities.
Educational attainment levels and socioeconomic status significantly influence IQ scores across different states. States with higher levels of educational attainment tend to have higher average IQ scores. Access to quality education, early childhood programs, and well-funded schools contribute to this trend. Conversely, states with lower educational attainment levels often face challenges such as underfunded schools and limited access to educational resources, which can negatively impact IQ scores.
- Days in the school year
- High school graduation rates
- PISA scores
- Student loan debt
- Literacy rate
- SAT scores
These related rankings reveal additional factors that correlate with IQ scores. For instance, states with longer school years and higher high school graduation rates often show higher average IQ scores. Conversely, higher student loan debt and lower literacy rates can indicate educational and economic challenges that impact cognitive development.
Regional differences in IQ scores are shaped by a combination of these factors. States with robust educational systems and strong economic foundations tend to produce higher IQ scores. Conversely, states facing economic hardships and educational deficiencies often struggle with lower average IQ scores. Understanding these factors is crucial for addressing disparities and fostering environments that support cognitive development across all regions.
Regional IQ Differences and Patterns
Data on IQ distribution across the U.S. reveals distinct patterns and regional nuances. States in the Northeast, such as Massachusetts and New Hampshire, consistently show higher average IQ scores. This trend extends to parts of the Midwest, including states like North Dakota and Minnesota. Conversely, the Southeast and certain Western states, such as Mississippi and California, tend to have lower average IQ scores. These patterns reflect a complex interplay of factors such as educational quality, economic conditions, and access to resources.
The implications of these regional IQ differences are significant for policy and resource allocation. States with higher average IQ scores often benefit from robust educational systems and economic stability, which in turn attract further investment and development. On the other hand, regions with lower average IQ scores may require targeted interventions to address educational and economic disparities. Policymakers can use this data to allocate resources more effectively, ensuring that educational programs and economic initiatives are tailored to the specific needs of each region.

To explore a detailed visualization of these regional IQ differences, access the Voronoi app. This tool provides an interactive map, allowing users to dive deeper into the data and understand the nuances of IQ distribution across the United States.
Historical IQ Trends in the USA
Historical data shows that average IQ scores in the USA have changed over time. These changes reflect various social, economic, and educational developments that have influenced cognitive abilities across different generations.
Educational reforms and economic shifts have played significant roles in shaping these trends. For instance, the implementation of widespread public education in the early 20th century led to noticeable improvements in average IQ scores. Similarly, economic prosperity periods, such as the post-World War II era, provided better access to education and resources, further boosting cognitive development. Conversely, economic downturns and disparities in educational quality have sometimes led to stagnation or declines in average IQ scores.
When comparing the USA's IQ trends with those of other countries, several differences emerge. While many Western countries have shown similar upward trends due to improved education and living standards, some developing nations have experienced slower progress. This comparison highlights the importance of sustained investment in education and economic stability to foster cognitive growth.
Methods of Measuring IQ and Data Collection
IQ scores in the United States are primarily derived from two major assessments: the Program for the International Assessment of Adult Competencies (PIAAC) and the National Assessment of Educational Progress (NAEP). The PIAAC assesses adult competencies in literacy, numeracy, and problem-solving in technology-rich environments, providing a comprehensive measure of cognitive abilities among adults. On the other hand, the NAEP, often referred to as the Nation's Report Card, evaluates the academic performance of children across various subjects, including mathematics and reading, offering insights into the cognitive development of younger populations.
In addition to these assessments, standardized test scores such as the SAT and ACT are also considered in measuring IQ. These tests, widely used for college admissions, assess critical reading, mathematical reasoning, and writing skills, serving as proxies for cognitive abilities. While not direct measures of IQ, the SAT and ACT scores provide valuable data points that contribute to understanding regional variations in cognitive performance.
Despite their widespread use, the reliability of IQ data and potential biases in measurement remain critical considerations. Factors such as cultural biases, socio-economic disparities, and test anxiety can influence test outcomes, leading to potential inaccuracies. Additionally, the narrow focus of these tests on specific cognitive skills may not fully capture the multifaceted nature of intelligence. Recognizing these limitations is essential for interpreting IQ scores accurately and for developing policies that address the broader educational and socio-economic factors impacting cognitive development.
Final Words
An examination of the average IQ by state in the USA reveals significant disparities influenced by multiple factors.
From the highest scores in Massachusetts to the lowest in Mississippi, these variations highlight the complex interplay between educational attainment, socioeconomic status, and regional differences.
Understanding these differences aids in formulating effective policies and resource allocation to bridge the IQ gap.
Evaluating historical IQ trends, data collection methods, and measurement tools enables a deeper comprehension of these variances.
In essence, this analysis not only illuminates the current landscape but also offers a roadmap for future improvement.

