Key points from the chart
- The chart plots 35 OECD countries by average working hours per week (vertical axis, 24 to 42) against average weekly wage in US dollars (horizontal axis, 200 to 1,400).
- Mexico sits alone at the top left, with the longest hours (about 41 a week) and one of the lowest wages.
- Germany, Norway and Denmark have the shortest hours, at about 26 to 27 a week, with weekly wages above $1,000.
- The United States combines relatively long hours, about 34, with one of the highest weekly wages, about $1,250.
- Bubble size shows the hourly wage, so the largest bubbles (Luxembourg, Iceland, Switzerland) sit at the bottom right.
All points are read from the graphic by Genuine Impact, which cites the OECD.
Working hours vs salary by country in text
Title: Working Hours vs. Salary. Subtitle: In OECD member countries. Credit: Created by Genuine Impact. Footer: “Source: OECD. Size of bubble corresponds to hourly wage.” and “More charts: genuineimpact.substack.com”.
The chart prints no figures for individual countries, only axis ticks. The values below are our own reading of each bubble’s centre against the gridlines, rounded to the nearest half hour and $50. Treat them as approximate; the OECD data the chart is drawn from gives the exact figures.
| Country | Average working hours per week (our reading) | Average weekly wage, US dollars (our reading) |
|---|---|---|
| Mexico | about 41 | about $350 |
| South Korea | about 38 | about $800 |
| Greece | about 37 | about $550 |
| Chile | about 37 | about $500 |
| Israel | about 36.5 | about $750 |
| Poland | about 35 | about $600 |
| Czech Republic | about 34 | about $550 |
| New Zealand | about 34 | about $850 |
| United States | about 34 | about $1,250 |
| Ireland | about 34 | about $950 |
| Hungary | about 33 | about $500 |
| Portugal | about 33 | about $500 |
| Italy | about 33 | about $750 |
| Estonia | about 33 | about $600 |
| Australia | about 33 | about $1,050 |
| Slovak Republic | about 32.5 | about $500 |
| Spain | about 32.5 | about $750 |
| Canada | about 32 | about $1,000 |
| Latvia | about 32 | about $550 |
| Japan | about 31.5 | about $750 |
| Lithuania | about 31.5 | about $550 |
| Slovenia | about 30.5 | about $750 |
| Belgium | about 30.5 | about $1,050 |
| Switzerland | about 30 | about $1,300 |
| Finland | about 29.5 | about $900 |
| United Kingdom | about 29.5 | about $900 |
| France | about 29 | about $900 |
| Luxembourg | about 29 | about $1,300 |
| Austria | about 29 | about $1,050 |
| Sweden | about 28 | about $900 |
| Iceland | about 28 | about $1,300 |
| Netherlands | about 27.5 | about $1,100 |
| Germany | about 26.5 | about $1,050 |
| Norway | about 26.5 | about $1,050 |
| Denmark | about 26.5 | about $1,100 |
What the chart shows about hours and pay
Genuine Impact’s newsletter post that carried the chart sums it up in one line: Switzerland, Luxembourg and Iceland have the highest pay and do it in around 28 to 30 hours a week, against 34 in the United States [1]. Mexican workers put in 41 hours a week for about $350, which the post calculates as 28% of what an average American earns [1].
The post also gives the spread across the OECD: average weekly wages range from about $300 to $1,300, and working hours from 26 to 41 a week [1]. Read together, the chart shows a broad pattern of shorter hours in higher wage countries, with the United States as the clearest exception among the high wage countries.
How the OECD measures hours worked
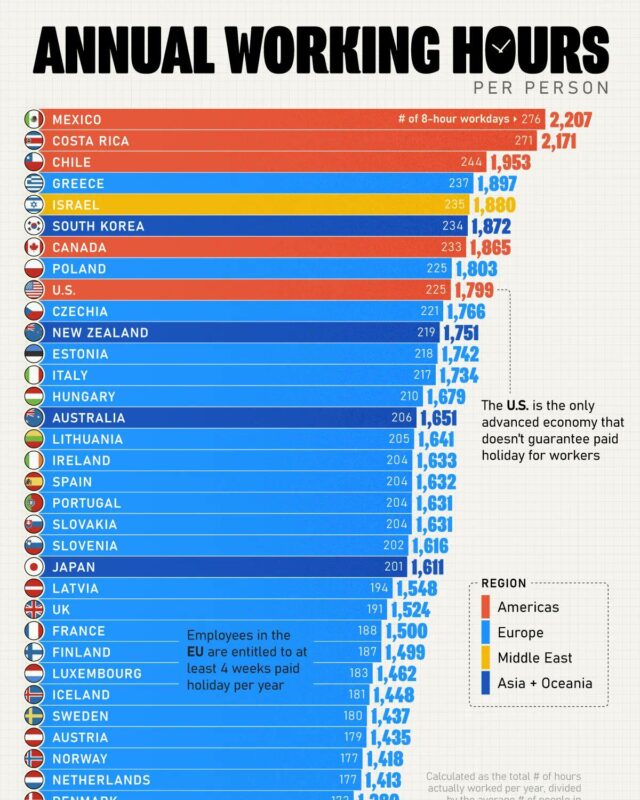
The OECD’s hours worked indicator is the total number of hours actually worked in a year divided by the average number of people in employment [2]. It includes full-time, part-time and part-year workers, paid and unpaid overtime and second jobs, and excludes holidays, annual leave, sickness, parental leave and strikes [2]. That is why the weekly figures on this chart look low next to a standard 40 hour week: part-time work and time off pull the average down.
In 2023 the annual figures across the OECD ranged from about 1,339 to 2,252 hours per worker [2].
A second chart, annual wages and hours by Latinometrics
Countries with higher wages work less hours, according to this Latinometrics chart of OECD data. It plots 36 countries by average annual wage and hours worked per year. Germany works the fewest hours, about 1,350, while Mexico and Colombia work over 2,200 for the lowest pay. The United States pairs high wages with above average hours.

- The chart plots 36 OECD countries and the OECD average by average annual wage (US dollars, PPP converted) against hours worked per person per year.
- Most dots fall along a line running from the top left to the bottom right: higher wage countries tend to work fewer hours.
- Germany works the fewest hours, about 1,350 a year. Colombia and Mexico work the most, about 2,300 and 2,200.
- The United States is the clearest exception, with wages near the top of the chart and hours above the OECD average.
- Latinometrics highlights four Latin American members with flags: Chile, Costa Rica, Colombia and Mexico, all in the low wage, long hours corner.
Notes on this infographic
- The OECD warns that its hours data “are intended for comparisons of trends over time” and “are unsuitable for comparisons of the level of average annual hours of work for a given year, because of differences in sources and methods of calculation” [2]. A cross-country chart like this one compares levels, so small gaps between countries should not be over-read.
- The chart shows 35 of the 38 OECD member countries; the OECD hours list also includes Colombia, Costa Rica and Türkiye [2], which are not on the graphic.
- Weekly wages are in US dollars and the chart does not say whether they are adjusted for living costs. The year of the data is not printed; the chart was published in December 2024 [1].
- Country values in our table are estimates from bubble positions, not published figures.
Questions about working hours and salaries
What is the average salary globally?
This chart covers OECD members only, not the world. Within the OECD, average weekly wages range from about $300 to $1,300, according to the chart’s creator [1].
If I work 35 hours a week, how many hours would I work in a year?
35 hours a week for 52 weeks is 1,820 hours (our arithmetic). The OECD’s annual figures count only hours actually worked, so holidays and leave bring the real total lower [2].
Which OECD country works the longest hours?
Mexico works the longest hours on the chart, about 41 a week, for one of the lowest weekly wages, about $350. Genuine Impact calculates that as 28% of what an average American earns [1]. In the Latinometrics chart of annual hours, Colombia and Mexico work the most, about 2,300 and 2,200 hours a year.
Which countries work the fewest hours?
Germany, Norway and Denmark have the shortest hours on the chart, at about 26 to 27 a week, with weekly wages above $1,000. The Latinometrics chart also puts Germany lowest, at about 1,350 hours a year. The OECD warns that its hours data suit comparisons of trends over time, not of levels between countries in a given year, because of differences in sources and methods [2].
Sources
- Genuine Impact, Labouring on a Global Wage Reality Check, 20 December 2024. The creator’s post carrying this chart.
- OECD, Hours worked (indicator).
- Latinometrics (Ernesto Canales and Gabriel Cohen), Wages: Mexico’s employment boom isn’t boosting wages, 14 January 2025.
Last reviewed 30 October 2026