Key points
- The graphic is a 3D treemap. Each block is a cause of death, sized by its share of the years of life lost each year, so causes that kill young people take up more space.
- Blocks are grouped into infectious diseases and birth problems (yellow and orange), noncommunicable diseases (pink, with cancers outlined in blue) and injuries (green).
- Colour shows the annual change from 2005 to 2010, from minus 3% to plus 3% a year.
- Its notes say malaria is one of the biggest killers of children, war accounts for 0.05% of life-years lost, natural disasters are the fastest-growing cause, and heart disease and stroke cause more than a quarter of deaths.
- The graphic names no source or creator.
The causes of untimely death graphic in text
Title: Causes of Untimely Death.
Infectious diseases and birth problems
Malaria, HIV/AIDS, TB, meningitis, measles, typhoid, tetanus, whooping cough, hepatitis, other infections, STDs, maternal disorders, starvation, neonatal infections, other neonatal conditions, preterm birth, diarrhoea (printed “Diarrhea”), lower respiratory infections and neonatal encephalopathy.
Noncommunicable diseases
Congenital anomalies, neurological, urinary, ulcers, cirrhosis, asthma, diabetes, kidney disease, emphysema and chronic bronchitis, other cardio and circulatory, ischaemic heart disease (printed “Ischemic”) and stroke. Cancer blocks: brain, pancreatic, cervical, breast, leukaemia, throat, other, stomach, colon, lung and liver.
Injuries
Fire, drowning, animals, machines, poison, falls, other, suicide, violence and road accidents, plus an unlabelled tall column for natural disasters and a thin sliver for war.
Annotations
- “Malaria, a preventable and treatable disease, is one of the biggest killers of children.”
- “War casualties account for just 0.05 percent of total life-years lost annually.”
- “Natural disasters are by far the fastest-growing contributor to the death toll.”
- “Heart disease and stroke cause more than a quarter of all deaths. But since they hit mainly older people, the cost in years of life lost is relatively small.”
Legend: annual % change (2005 to 2010), in six shades per group, with ticks at minus 3%, minus 2%, minus 1%, 0%, 1%, 2% and 3%. No figures are printed on the blocks, so the graphic shows relative size only.
What “years of life lost” means
Years of life lost (YLLs) count how early each death happens, so a death in childhood counts for far more than a death in old age. That is why the treemap gives so much room to neonatal conditions, preterm birth and infections such as malaria, and why its own note says heart disease and stroke cost relatively few years because they mainly hit older people.
The graphic’s categories and its 2005 to 2010 period match the Global Burden of Disease Study 2010, published in The Lancet in 2012 [1]. That study estimated 52.8 million deaths worldwide in 2010. It found that ischaemic heart disease and stroke together killed 12.9 million people, or one in four deaths, and that the leading causes of years of life lost in 2010 were ischaemic heart disease, lower respiratory infections, stroke, diarrhoeal disease, malaria and HIV/AIDS [1]. It put malaria deaths at 1.17 million in 2010, up 19.9% since 1990, and found a 46% rise in road traffic deaths over the same period, to 1.3 million [1]. The graphic does not name this study, so we cannot confirm it was the data source.
How the picture has changed
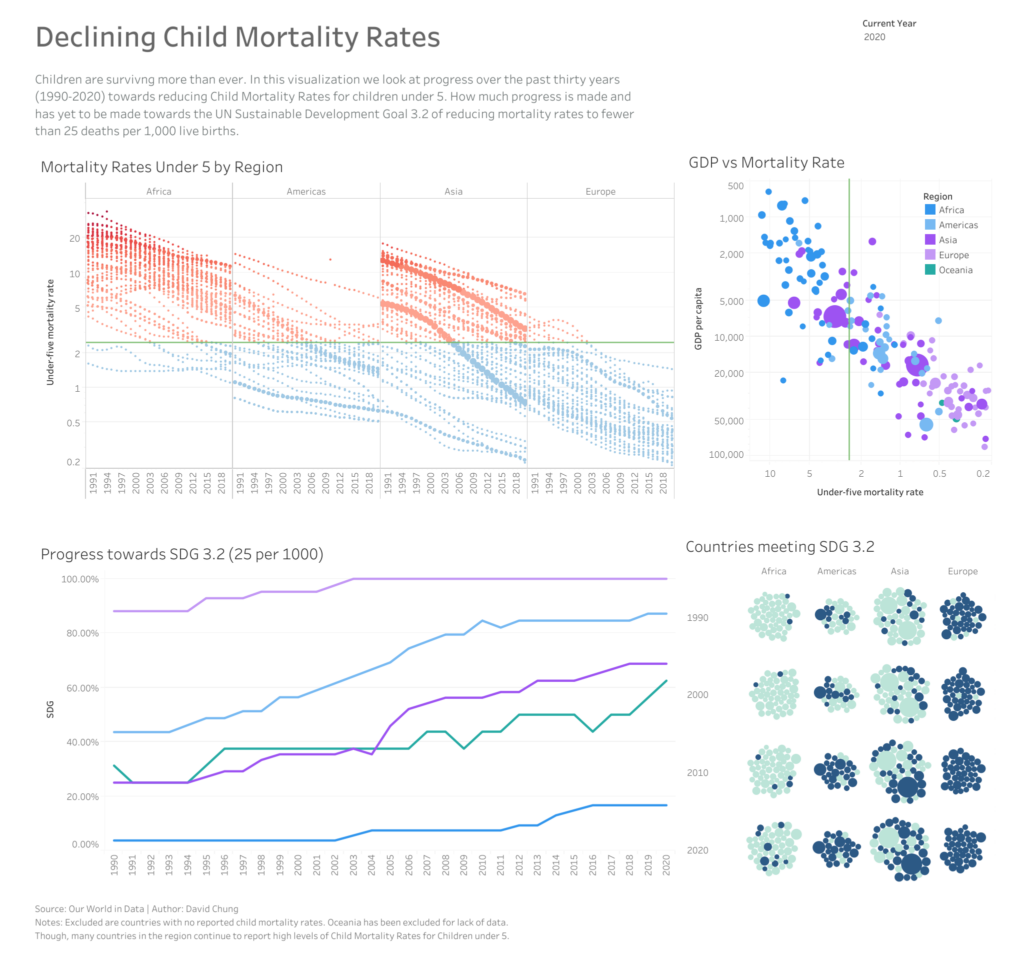
The World Health Organization’s latest estimates cover 2023. It counted 61 million deaths worldwide, with the 10 leading causes accounting for 54% [2]. Ischaemic heart disease is the biggest killer at 16% of all deaths, followed by stroke at about 11% and chronic obstructive pulmonary disease at about 6% [2]. Lower respiratory infections were the deadliest communicable disease, with 2.7 million deaths [2].
WHO also reports large falls in some causes shown in yellow on the graphic. Deaths from HIV and AIDS fell by 62% between 2000 and 2023, and in low-income countries deaths from diarrhoeal diseases roughly halved over the same period [2]. In low-income countries, 7 of the top 10 causes of death in 2023 were still communicable diseases, with malaria, tuberculosis and HIV and AIDS all in the top 10 [2].
Notes on this infographic
- “More than a quarter”. The GBD 2010 study puts ischaemic heart disease and stroke at one in four deaths in 2010 (12.9 million of 52.8 million, about 24%) [1], slightly below the graphic’s “more than a quarter”.
- Heart disease and life-years. The graphic says the cost of heart disease and stroke in years of life lost is “relatively small”. GBD 2010 still ranks ischaemic heart disease first and stroke third among causes of years of life lost in 2010 [1]. Their share is smaller than their share of deaths, not small in absolute terms.
- Unverified notes. We could not find a source for the 0.05% war figure or the claim about natural disasters.
- Dated data. The colours describe 2005 to 2010. See the WHO figures above for 2023 [2].
- Creator. No logo, credit or source line appears on the image and we could not trace the original publisher.
Questions about causes of untimely death
What causes the most years of life lost worldwide?
The Global Burden of Disease Study 2010 found that the leading causes of years of life lost in 2010 were ischaemic heart disease, lower respiratory infections, stroke, diarrhoeal disease, malaria and HIV/AIDS [1]. Because deaths in childhood count for far more years, the treemap gives a lot of room to neonatal conditions, preterm birth and infections such as malaria.
What is the leading cause of death in the world?
Ischaemic heart disease is the biggest killer, causing 16% of all deaths in 2023, according to the World Health Organization [2]. Stroke follows at about 11% and chronic obstructive pulmonary disease at about 6% [2]. WHO counted 61 million deaths worldwide in 2023, with the 10 leading causes accounting for 54% [2].
What does years of life lost mean?
Years of life lost count how early each death happens, so a death in childhood counts for far more than a death in old age. That is why the graphic notes that heart disease and stroke cause more than a quarter of all deaths but cost relatively few years, since they mainly hit older people. GBD 2010 still ranks ischaemic heart disease first and stroke third for years of life lost in 2010 [1].
How many people die from malaria each year?
The Global Burden of Disease Study 2010 put malaria deaths at 1.17 million in 2010, up 19.9% since 1990 [1]. The graphic calls malaria "a preventable and treatable disease" and "one of the biggest killers of children". WHO reports that malaria was still in the top 10 causes of death in low-income countries in 2023 [2].
Sources
- Lozano R. et al., Global and regional mortality from 235 causes of death for 20 age groups in 1990 and 2010, The Lancet, 2012 (Global Burden of Disease Study 2010, PubMed abstract).
- World Health Organization, The top 10 causes of death, fact sheet based on Global Health Estimates to 2023.
Last reviewed 30 October 2026