Key figures from the treemaps
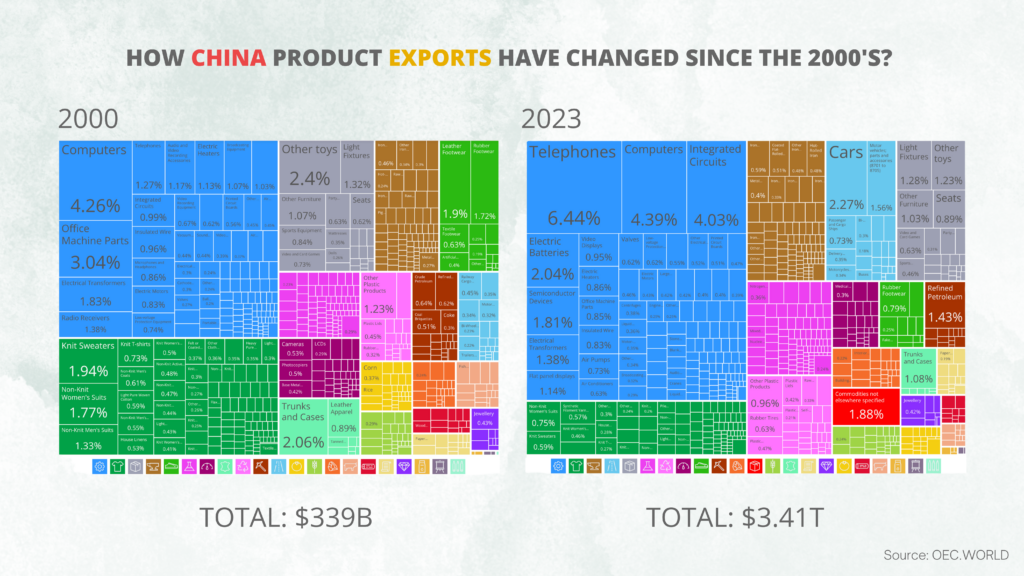
- China’s exports totalled $3.41 trillion in 2023 on both charts.
- Telephones are the largest single product at 6.44% of exports, followed by computers (4.39%) and integrated circuits (4.03%). Together those three make up 14.86% (our sum).
- Machinery and electronics, the blue block, covers roughly half of the product chart.
- The United States is the largest single destination at 14.6%, ahead of Hong Kong (8.16%), Japan (4.63%), South Korea (4.42%) and Vietnam (4.16%).
- The footer gives the source as OEC.WORLD, the Observatory of Economic Complexity.
China export products in 2023, in text
The left treemap sizes each product by its share of China’s $3.41 trillion of exports, coloured by sector. Below are all tiles that carry both a name and a figure. Some names are cut short on the graphic (for example “Delivery…” and “Sports…”), and we have completed them only where the meaning is clear. Many small tiles have no readable label.
| Sector (tile colour) | Products and share of exports |
|---|---|
| Machinery and electronics (blue) | Telephones 6.44%, Computers 4.39%, Integrated Circuits 4.03%, Electric Batteries 2.04%, Semiconductor Devices 1.81%, Electrical Transformers 1.38%, Flat panel displays 1.14%, Video Displays 0.95%, Electric Heaters 0.86%, Office Machine Parts 0.85%, Insulated Wire 0.83%, Air Pumps 0.73%, Air Conditioners 0.63%, Valves 0.62%, Low-voltage Protection 0.62%, Other Electrical 0.52%, Printed Circuit Boards 0.51%, Electric Motors 0.43%, Centrifuges 0.38%, Broadcasting 0.32% |
| Transportation (light blue) | Cars 2.27%, Motor vehicles parts and accessories (8701 to 8705) 1.56%, Passenger and Cargo Ships 0.73%, Delivery trucks 0.35%, Motorcycles 0.34%, Buses (no figure) |
| Miscellaneous (grey) | Light Fixtures 1.28%, Other toys 1.23%, Other Furniture 1.03%, Seats 0.89%, Video and Card Games 0.63%, Sports equipment 0.46% |
| Unspecified (red) | Commodities not elsewhere specified 1.88% |
| Mineral products | Refined Petroleum 1.43% |
| Animal hides | Trunks and Cases 1.08% |
| Plastics and rubber (pink) | Other Plastic Products 0.96%, Rubber Tires 0.63%, Plastic Lids 0.42% |
| Textiles (dark green) | Non-Knit Women’s Suits 0.75%, Knit Sweaters 0.59%, Synthetic Filament Yarn 0.57%, Knit Women’s clothing 0.46% |
| Footwear (green) | Rubber Footwear 0.79% |
| Metals (brown) | Coated Flat-Rolled iron 0.51%, Other Iron products 0.48%, Hot-Rolled Iron 0.48%, Metal products 0.4% |
| Precious metals (violet) | Jewellery 0.42% |
| Chemicals (magenta) | Nitrogen products 0.36% |
| Instruments | Medical instruments 0.3% |
Where China’s exports went in 2023
The right treemap shows destinations, coloured by continent, again out of a $3.41 trillion total.
| Region | Destinations and share of exports |
|---|---|
| North America | United States 14.6%, Mexico 2.4%, Canada 1.32%, Panama 0.33% |
| Asia | Hong Kong 8.16%, Japan 4.63%, South Korea 4.42%, Vietnam 4.16%, India 3.47%, Malaysia 2.64%, Singapore 2.33%, Thailand 2.25%, Chinese Taipei 2.01%, Indonesia 1.93%, United Arab Emirates 1.65%, Philippines 1.58%, Saudi Arabia 1.28%, Turkey 1.14%, Kazakhstan 0.73%, Bangladesh 0.68%, Kyrgyzstan 0.58%, Pakistan 0.52%, Israel 0.44%, Iraq 0.43%, Cambodia 0.38%, Burma 0.34%, Iran 0.3%, Jordan (no figure) |
| Europe | Russia 3.26%, Germany 2.96%, Netherlands 2.95%, United Kingdom 2.31%, Italy 1.31%, France 1.22%, Spain 1.17%, Poland 1.1%, Belgium 0.96%, Greece 0.38%, Hungary 0.29%, Sweden 0.28%, Denmark 0.24%, Romania 0.23%, Austria, Slovenia and Belarus (no figures) |
| Oceania | Australia 2.19%, New Zealand 0.23% |
| South America | Brazil 1.74%, Chile 0.58%, Colombia 0.36%, Argentina 0.32% |
| Africa | South Africa 0.7%, Nigeria 0.61%, Egypt 0.44%, Liberia 0.29%, Ghana 0.28%, Algeria 0.28%, Tanzania 0.24%, Angola (no figure) |
As a rough guide, 14.6% of $3.41 trillion is about $498 billion of goods to the United States, and 8.16% is about $278 billion to Hong Kong. Those dollar values are our arithmetic, not figures printed on the graphic.
China’s place among the world’s exporters
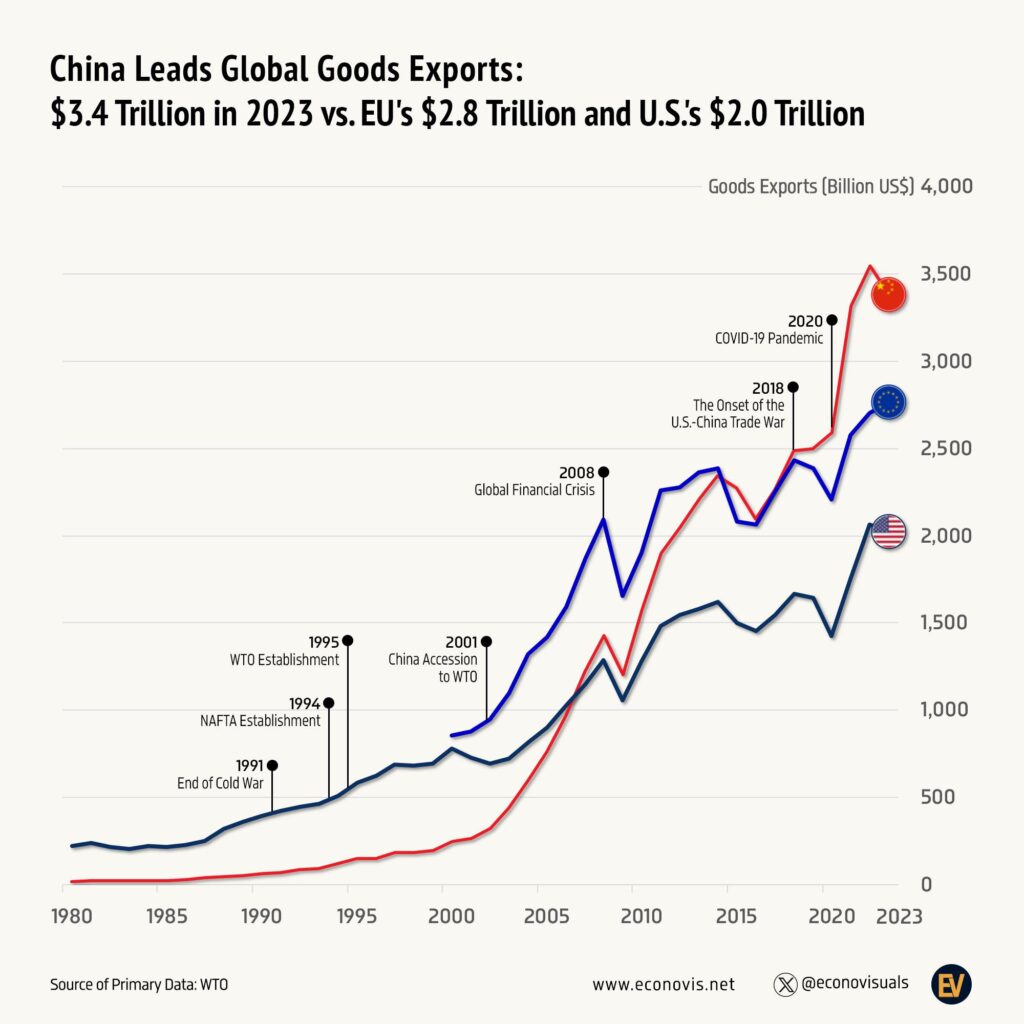
Econovis, using a separate dataset, puts China’s goods exports at $3.38 trillion in 2023, up from $0.25 trillion in 2000, a compound annual growth rate of 12.0% [2]. Over the same years the European Union’s exports rose from $0.86 trillion to $2.76 trillion and U.S. goods exports from $0.78 trillion to $2.02 trillion, which made China the world’s largest goods exporter [2]. The small gap between $3.38 trillion and the $3.41 trillion on this graphic reflects the different data publishers.
Notes on this infographic
- Data date and source. Both charts are for 2023 and cite OEC.WORLD [1]. OEC’s own pages load their figures interactively, so we checked the total against Econovis rather than reading OEC’s tables directly.
- Names. “Chinese Taipei” is the label used for Taiwan, and “Burma” for Myanmar. Hong Kong appears as a separate destination.
- Legend. The sector and continent legends are icons only, with no text. The sector names in our table are our reading of the colours and icons.
- Truncated tiles. Several tiles show only a fragment such as “Iron…” or “Other…”, and some show a percentage with no name. They are left out of the tables above.
Questions about China export products
What does China export?
Mostly machinery and electronics. On this graphic the largest products in 2023 were telephones (6.44% of exports), computers (4.39%), integrated circuits (4.03%), cars (2.27%) and electric batteries (2.04%).
Where does China rank in exports?
First among goods exporters. Econovis puts China’s 2023 goods exports at $3.38 trillion, ahead of the European Union at $2.76 trillion and the United States at $2.02 trillion [2].
What countries does China export to?
Every continent. The largest destinations on the graphic are the United States (14.6%), Hong Kong (8.16%), Japan (4.63%), South Korea (4.42%), Vietnam (4.16%) and India (3.47%).
Sources
- The Observatory of Economic Complexity, China country profile (data source named on the graphic).
- Econovis, China Leads Global Goods Exports, $3.4 Trillion in 2023.
Last reviewed 29 October 2026