How much does China export to the US?
China exports to the US came to $501 billion of goods in 2023 on China’s own customs figures, 14.8% of everything China sold abroad [2]. US records put imports from China lower, at $427 billion in 2023 and $308.7 billion in 2025 [3]. China now relies on American buyers far less than it did. The US share of China’s exports fell from about a fifth in 2017 to 11.1% in 2025 [2][5].
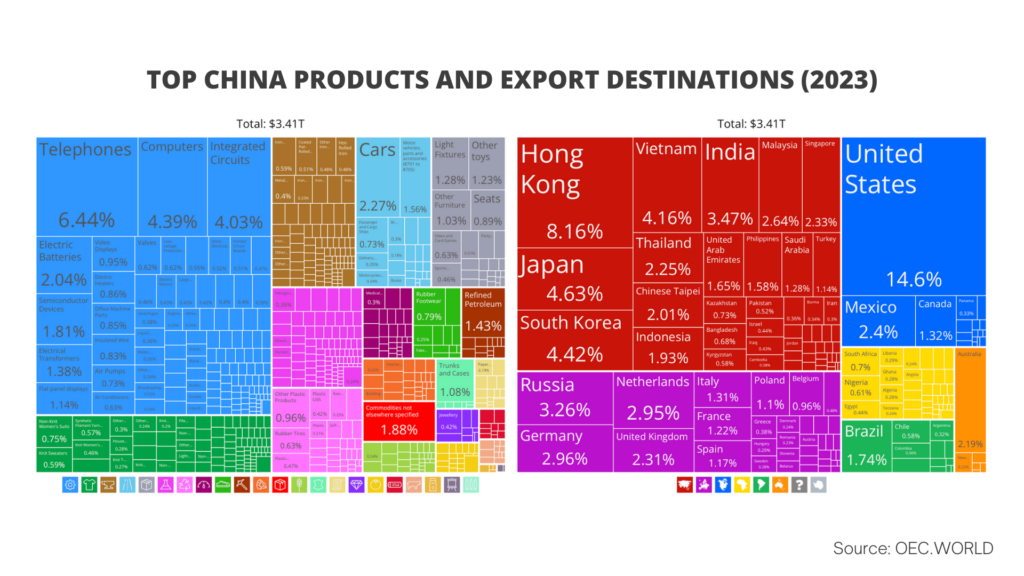
The US is still China’s biggest single-country market, ahead of Hong Kong, South Korea and Japan [5]. But as blocs, Southeast Asia (ASEAN) and the European Union now each buy more Chinese goods than the US does. For China’s exports to every market, and what China sells overall, see our article on China’s global goods exports in 2023.
China exports to the US by year
US imports from China grew almost every year for three decades, peaked in 2018 and have fallen sharply since. These are the US Census Bureau’s annual totals for goods imported from China, with China’s share of all US goods imports (our arithmetic from the Census tables) [3][4].
| Year | US goods imports from China | China’s share of US goods imports |
|---|---|---|
| 1985 | $3.9 billion | 1.1% (Econovis) |
| 1999 | $81.8 billion | 8.0% |
| 2005 | $243.5 billion | 14.5% |
| 2010 | $365.0 billion | 19.1% |
| 2017 | $505.2 billion | 21.6% |
| 2018 | $538.5 billion | 21.2% |
| 2020 | $432.5 billion | 18.6% |
| 2022 | $536.3 billion | 16.6% |
| 2023 | $427.2 billion | 13.9% |
| 2024 | $440.3 billion | 13.5% |
| 2025 | $308.7 billion | 9.0% |
The 2025 total was 29.9% lower than 2024 and 43% below the 2018 peak [3]. The US goods trade deficit with China, which reached $418.2 billion in 2018, was $202.7 billion in 2025 [3][6]. In the first nine months of 2026 the US imported $215.0 billion of goods from China, 11.5% less than in the same months of 2025, and China supplied 7.7% of all US goods imports (our arithmetic) [3][4]. Monthly imports have been rising again through 2026, though. September 2026 ($31.5 billion) was the highest month since February 2025 [3].
What share of China’s exports go to the US?
On China’s own customs figures, the US took 14.8% of China’s exports in 2023 and 11.1% in 2025 [2][5]. That is well down on the 21% to 22% of the late 1990s and early 2000s [2].
| Year | China’s exports to the US (China customs) | US share of China’s exports |
|---|---|---|
| 1999 | $42.0 billion | 21.6% |
| 2005 | $163.2 billion | 21.4% |
| 2017 | $430.3 billion | 19.0% |
| 2023 | $501.2 billion | 14.8% |
| 2025 | $420.1 billion | 11.1% |
The Econovis infographic with this article gives much higher figures for the 1990s, with the US taking 42% of China’s exports at a 1999 peak, then 22% in 2016 to 2018 and 13% in 2023 [1]. Its red line divides US-recorded imports from China by China’s total exports, two figures from different countries’ records. We checked this. US imports from China in 1999 ($81.8 billion) divided by China’s exports that year ($194.9 billion) gives exactly 42% [2][3]. On China’s own figures the 1999 share was 21.6% [2]. The difference is mostly goods that left China through Hong Kong. China records those as exports to Hong Kong, while the US records them as imports from China. The gap was huge in the 1990s, when most Chinese trade went through Hong Kong, and has narrowed since. So the fall in China’s reliance on the US is real, but it was a fall from about a fifth, not from over 40%.
Why US and Chinese trade figures don’t match
The two countries’ numbers for the same trade have never agreed. China records goods by where it ships them, so anything sent to Hong Kong, Vietnam or Mexico first may not count as an export to the US. The US records imports by country of origin, so Chinese-made goods arriving through a third country can still count as imports from China. The US also values imports differently from the way China values exports, and goods in transit at year end can fall into different years.
In 2023 the gap ran the other way from the 1990s. China reported $501.2 billion of exports to the US, while the US reported $427.2 billion of imports from China [2][3]. Some of that gap is likely to be goods finished or repacked in third countries, and some will be valuation and timing differences. Neither figure is wrong, but you should always compare like with like.
Why China’s exports to the US have fallen
The trade war is the main reason. The US put tariffs on hundreds of billions of dollars of Chinese goods from 2018, and China retaliated [6]. A phase one deal in January 2020 paused the escalation, but most tariffs stayed [6]. In 2025 the second Trump administration raised tariffs on Chinese goods again, at one point to 145%, with China putting 125% on American goods in reply [6]. US imports from China fell by almost a third that year [3].
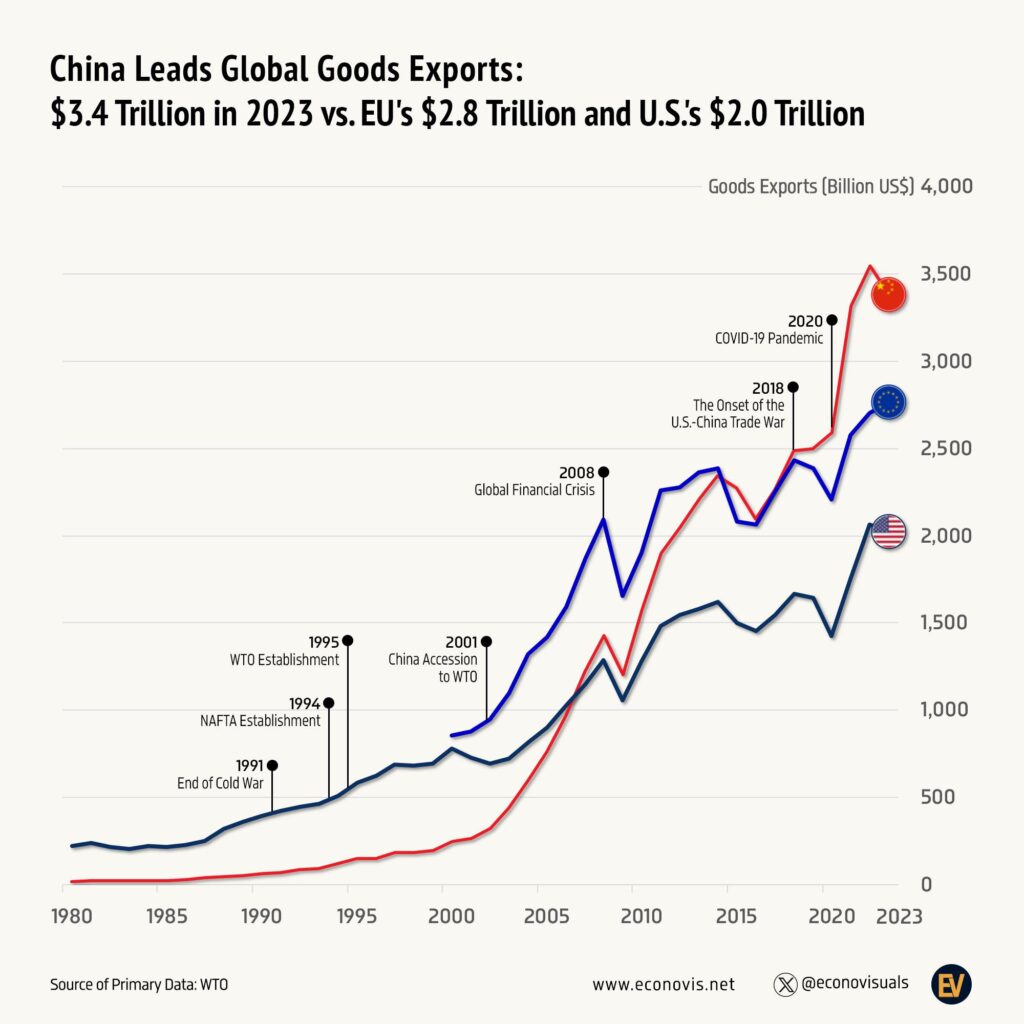
Econovis gives a second reason in its note with the chart. China grew into the world’s largest exporter and spread its sales across many more markets [1]. Its exports to ASEAN reached $665.2 billion in 2025 and to the EU $559.9 billion, both well above the $420.1 billion it sold to the US [5]. Supply chains have also moved. Some production for the US market has shifted from China to countries such as Vietnam and Mexico, often still using Chinese parts.
The US side mirrors this. China’s share of US imports peaked at 21.6% in 2017 and has more than halved since, to 9.0% in 2025 and 7.7% in the first nine months of 2026 (our arithmetic from the Census figures) [3][4]. Mexico overtook China as the largest supplier of goods to the US in 2023, with $472.9 billion of goods against China’s $427.2 billion [3][9].
What China sells to the US
Most of what China sells to the US is machinery and electrical equipment. That group made up 42.7% of China’s exports to the US in 2023, about $214 billion, on World Bank WITS figures [7]. It includes mobile phones, computers, batteries and household electrical goods.
| Product group | China’s exports to the US in 2023 | Share |
|---|---|---|
| Machinery and electrical equipment | $213.8 billion | 42.7% |
| Miscellaneous manufactures (toys, furniture, lighting and more) | $97.0 billion | 19.4% |
| Textiles and clothing | $45.4 billion | 9.1% |
| Metals | $28.2 billion | 5.6% |
| Plastics and rubber | $26.6 billion | 5.3% |
| Transport equipment | $20.4 billion | 4.1% |
| Chemicals | $18.2 billion | 3.6% |
| Footwear | $15.9 billion | 3.2% |
By type of goods, consumer goods made up 45.5% of the total and capital goods 42.7% [7]. That mix explains why tariffs on Chinese goods show up quickly in US shop prices for electronics, toys, clothing and furniture.
What the US sells to China
Trade in the other direction is much smaller. US goods exports to China were $106.0 billion in 2025, down 26.0% on 2024, according to the US Trade Representative [8]. Services are the one area where the US runs a surplus with China. US services exports to China were $57.2 billion in 2025 against imports of $22.8 billion, a surplus of $34.4 billion [8]. Counting goods and services together, US trade with China was $494.6 billion in 2025, down 25.1% on 2024 [8].
Questions about China exports to the US
What percentage of China’s exports go to the US?
11.1% in 2025 and 14.8% in 2023, on China’s customs figures [2][5]. It was around a fifth from the late 1990s until the trade war began in 2018. Charts that show 42% for 1999, including the Econovis infographic here, mix US import records with China’s export total.
What is the most exported product from China to the USA?
Machinery and electrical equipment, at $213.8 billion in 2023, or 42.7% of China’s exports to the US [7]. That group includes mobile phones, laptops and other computers, and lithium-ion batteries.
Who are China’s largest trading partners?
As a single country, the United States, with $559.7 billion of two-way goods trade in 2025, followed by Hong Kong, South Korea, Japan and Taiwan [5]. As blocs, ASEAN ($1.05 trillion) and the EU ($828.1 billion) are bigger [5].
How much does the US import from China?
$308.7 billion of goods in 2025, down from $440.3 billion in 2024 and a peak of $538.5 billion in 2018 [3]. From January to September 2026 it was $215.0 billion [3].
Is the US still China’s biggest customer?
Yes, as a single country. But ASEAN and the EU each buy more from China as groups, and China’s exports to them have grown while sales to the US have fallen [5].
Sources
- Econovis, China’s Export Reliance on the U.S. Falls Sharply, Mirroring U.S. Import Shift Away from China, January 2025 (US Census and WTO data). This is the original post for the infographic.
- World Bank WITS, China trade summaries for 1999, 2005, 2017 and 2023 (China customs data).
- US Census Bureau, Trade in Goods with China, to September 2026.
- US Census Bureau, Trade in Goods with World, Not Seasonally Adjusted.
- Wikipedia, List of the largest trading partners of China (2025 China customs figures).
- Wikipedia, China and United States trade war.
- World Bank WITS, China product exports to the United States 2023.
- Office of the US Trade Representative, The People’s Republic of China trade summary.
- US Census Bureau, Trade in Goods with Mexico.
Last reviewed 13 November 2026