Key figures
- China exported $3.4 trillion of goods in 2023, more than the European Union ($2.8 trillion) and the United States ($2.0 trillion), as the chart’s title says.
- Econovis gives the exact 2023 figures as $3.38 trillion for China, $2.76 trillion for the EU and $2.02 trillion for the US [1].
- China’s goods exports grew from $0.25 trillion in 2000, a compound annual growth rate of 12.0%, against 5.2% for the EU and 4.2% for the US [1].
- In the chart, China’s line passes the US in the mid 2000s and the EU in the mid 2010s.
The data are from the World Trade Organization (WTO), as the chart’s footer says.
China exports 2023 chart, in text
Title: China Leads Global Goods Exports, $3.4 Trillion in 2023 vs. EU’s $2.8 Trillion and U.S.’s $2.0 Trillion. Line chart of goods exports in billions of US dollars, 1980 to 2023, with the vertical axis on the right running from 0 to 4,000 in steps of 500. China is the red line, the EU the blue line and the US the navy line, each ending in a round flag icon. The US and China lines start in 1980; the EU line starts in 2000.
The chart prints no values for individual years except the 2023 totals in its title. The figures for 2000 and 2023 below are from Econovis’s post for this chart [1].
| Exporter | Goods exports 2000 | Goods exports 2023 | Compound annual growth 2000 to 2023 |
|---|---|---|---|
| China | $0.25 trillion | $3.38 trillion | 12.0% |
| European Union | $0.86 trillion | $2.76 trillion | 5.2% |
| United States | $0.78 trillion | $2.02 trillion | 4.2% |
Seven events are marked with pins on the lines:
| Year marked | Event (as labelled) |
|---|---|
| 1991 | End of Cold War |
| 1994 | NAFTA Establishment |
| 1995 | WTO Establishment |
| 2001 | China Accession to WTO |
| 2008 | Global Financial Crisis |
| 2018 | The Onset of the U.S.-China Trade War |
| 2020 | COVID-19 Pandemic |
Footer: “Source of Primary Data: WTO”, www.econovis.net, @econovisuals and the Econovis EV logo.
What the lines show
For the 1980s and 1990s only the US and China are drawn, and the US line is far higher. China’s line rises slowly through the 1990s and much faster after the pin for its WTO accession; the WTO’s own page confirms China has been a member since 11 December 2001 [3]. The WTO itself was established on 1 January 1995, the date of the pin labelled “WTO Establishment” [4].
All three lines fall in 2009, after the pin for the global financial crisis. The EU and US lines also dip in 2020, the year marked for the COVID-19 pandemic, while China’s line keeps rising that year. China’s line reaches its highest point shortly before 2023 and is slightly lower in the final year.
China’s share of world exports
Econovis made a companion chart of the same three exporters’ shares of world goods exports. It reports that China’s share reached 14.2% in 2023, against 11.6% for the EU and 8.5% for the US, and that between 2000 and 2015 China’s share rose from 3.9% to 13.7% while the US share fell from 12.1% to 9.1% [2].
The companion chart, China’s share of world exports
This Econovis line chart tracks China share of world exports of goods from 1980 to 2023 and compares it with the European Union and the United States. China reached 14.2% in 2023, ahead of the EU at 11.6% and the US at 8.5%. The chart marks seven events, from the end of the Cold War to the COVID-19 pandemic.
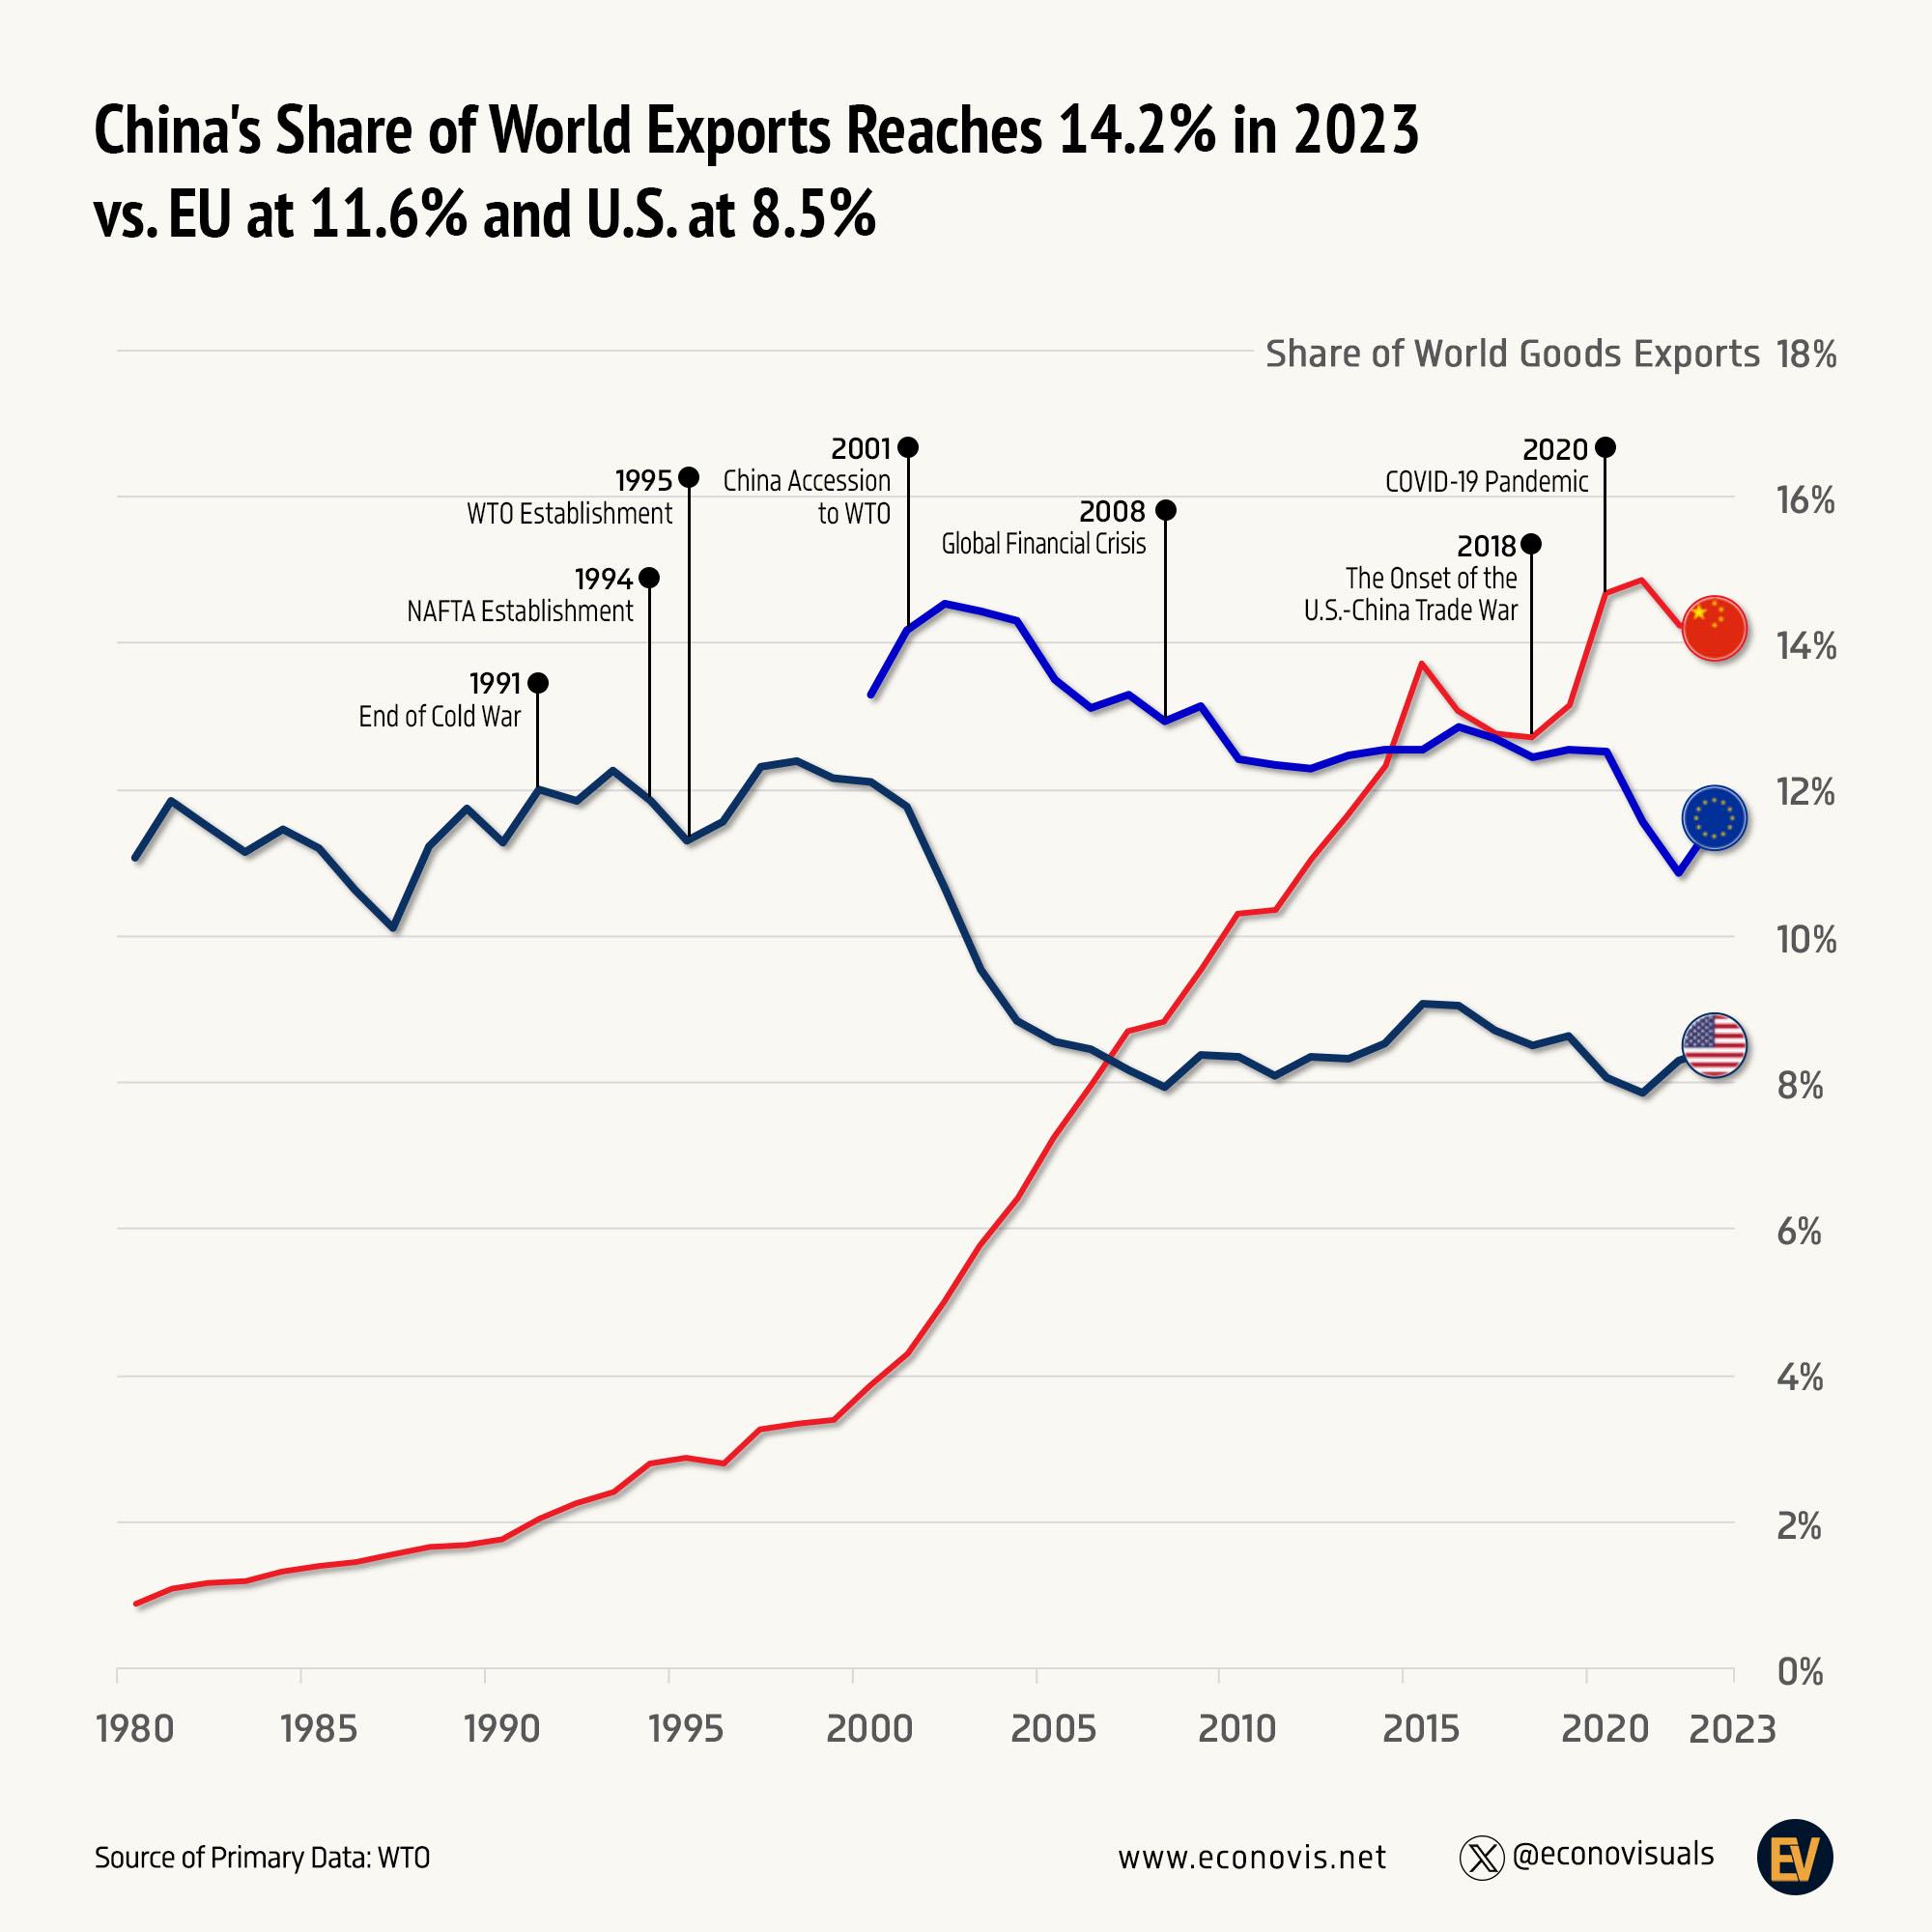
- China’s share of world goods exports reached 14.2% in 2023, against 11.6% for the European Union and 8.5% for the United States.
- Between 2000 and 2015 China’s share rose from 3.9% to 13.7%, while the EU stayed at around 13% and the US fell from 12.1% to 9.1%.
- China’s red line passes the US line around 2007 and the EU line around 2015.
- The chart marks seven events, including China’s accession to the WTO in 2001 and the start of the US and China trade war in 2018.
All figures are from the graphic and the Econovis post that goes with it, which names the WTO as its source of primary data.
Notes on this infographic
- The chart’s title rounds the 2023 values: $3.38 trillion appears as $3.4 trillion and $2.76 trillion as $2.8 trillion [1].
- The figures cover goods only. Trade in services is not included.
- The EU series begins in 2000. The chart does not say whether trade between EU member states is counted in the EU total, and we could not confirm this from the creator’s post.
- Readings of where lines cross are from the drawn lines, not from printed values.
Questions about China's goods exports
How much did China export in 2023?
China exported $3.38 trillion of goods in 2023, according to Econovis's figures based on World Trade Organization data [1]. That was more than the European Union ($2.76 trillion) and the United States ($2.02 trillion) [1]. The chart's title rounds these to $3.4 trillion, $2.8 trillion and $2.0 trillion. The figures cover goods only, not trade in services.
How fast have China's exports grown since 2000?
China's goods exports grew from $0.25 trillion in 2000 to $3.38 trillion in 2023, a compound annual growth rate of 12.0% [1]. Over the same period EU exports grew 5.2% a year, from $0.86 trillion, and US exports 4.2% a year, from $0.78 trillion [1]. On the chart, China's line rises much faster after its accession to the WTO, which the WTO dates to 11 December 2001 [3].
What share of world exports does China have?
China's share of world goods exports reached 14.2% in 2023, against 11.6% for the European Union and 8.5% for the United States [2]. Between 2000 and 2015 China's share rose from 3.9% to 13.7%, while the US share fell from 12.1% to 9.1% [2]. These figures come from a companion Econovis chart of the same three exporters.
When did China overtake the US in exports?
China's goods exports line passes the US line in the mid 2000s and the EU line in the mid 2010s. The companion Econovis chart of shares of world exports places the crossings around 2007 for the US and around 2015 for the EU. These are readings from the drawn lines, since the chart prints no values for individual years except the 2023 totals.
Sources
- Econovis, China Leads Global Goods Exports, $3.4 Trillion in 2023 vs. EU’s $2.8 Trillion and U.S.’s $2.0 Trillion (6 January 2025), the creator’s post for this chart.
- Econovis, China’s Share of World Exports Reaches 14.2% in 2023 vs. EU at 11.6% and U.S. at 8.5% (18 January 2025).
- World Trade Organization, China and the WTO.
- World Trade Organization, Who we are.
- World Trade Organization, Global Trade Outlook and Statistics, April 2024, Appendix Tables 1 and 2.
- Alessandro Nicita and Carlos Razo, UNCTAD, China: The rise of a trade titan, 27 April 2021.
Last reviewed 30 October 2026