Key figures
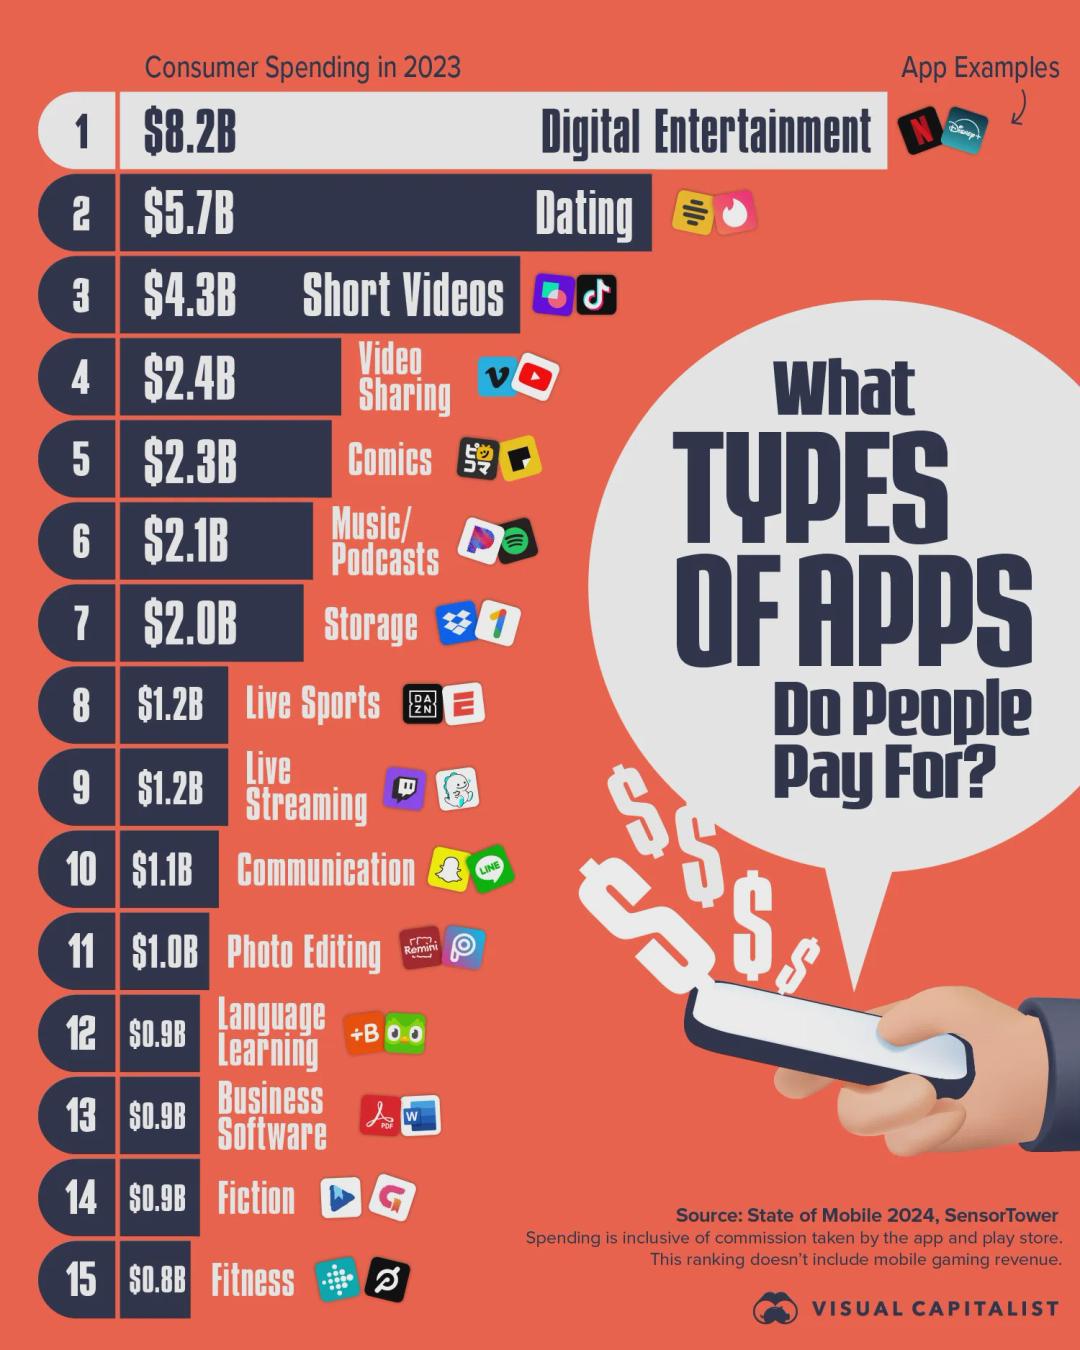
- Digital entertainment apps, such as Netflix and Disney+, took the most consumer spending in 2023: $8.2 billion.
- Dating apps were second with $5.7 billion, and short video apps third with $4.3 billion.
- The top three categories together took $18.2 billion, more than the other twelve combined, $16.8 billion (our arithmetic).
- Fitness apps were 15th at $0.8 billion. Mobile games are not included.
All figures are from the graphic, which cites Sensor Tower’s State of Mobile 2024.
App consumer spending 2023 by category, in text
Title: What Types of Apps Do People Pay For? Column headings: Consumer Spending in 2023; App Examples. Rank 1 is highlighted in white; the rest are navy bars. App names in the last column are our identification of the icons, checked against the examples Visual Capitalist names for each category [1].
| Rank | App category | Consumer spending in 2023 | App examples (icons on the graphic) |
|---|---|---|---|
| 1 | Digital Entertainment | $8.2B | Netflix, Disney+ |
| 2 | Dating | $5.7B | Bumble, Tinder |
| 3 | Short Videos | $4.3B | TikTok and one icon we could not identify |
| 4 | Video Sharing | $2.4B | Vimeo, YouTube |
| 5 | Comics | $2.3B | Piccoma and one icon we could not identify |
| 6 | Music/Podcasts | $2.1B | Pandora, Spotify |
| 7 | Storage | $2.0B | Dropbox, Google One |
| 8 | Live Sports | $1.2B | DAZN, ESPN |
| 9 | Live Streaming | $1.2B | Twitch, BIGO LIVE |
| 10 | Communication | $1.1B | Snapchat, LINE |
| 11 | Photo Editing | $1.0B | Remini, Picsart |
| 12 | Language Learning | $0.9B | Babbel, Duolingo |
| 13 | Business Software | $0.9B | Adobe Acrobat Reader, Microsoft Word |
| 14 | Fiction | $0.9B | GoodNovel and one other reading app |
| 15 | Fitness | $0.8B | Fitbit, Peloton |
Footer: “Source: State of Mobile 2024, SensorTower. Spending is inclusive of commission taken by the app and play store. This ranking doesn’t include mobile gaming revenue.” Visual Capitalist logo.
Why people pay for apps
Visual Capitalist’s article on the chart notes that many useful apps, such as email, messaging and social media, cost nothing, but people pay anyway to remove adverts, reach content behind paywalls or get a more exclusive service [1]. Media access is the common thread in the list, from live sports and music to comics and books [1].
On dating apps, the article says Tinder was the first non-game app to reach $1 billion in user spending, in 2020, and that dating apps charge either to see more profiles or to boost a user’s profile [1]. It reports that about 11% of Tinder’s users are paying members and that they account for about 60% of its revenue [1].
The wider picture from State of Mobile 2024
Sensor Tower’s report, the data source for the chart, says global consumer spending rose 4% in 2023 after a 2% fall in 2022, with apps holding up while spending in games was squeezed by inflation [2]. It also found that the weighted average time spent on mobile across the top 10 markets passed five hours in 2023, up 2% on the year before [2].
Notes on this infographic
- The figures are global consumer spending in 2023 and include the commission app stores take, as the footer says.
- Ranks 8 and 9 both show $1.2 billion, and ranks 12 to 14 all show $0.9 billion; the order between them comes from unrounded figures that the graphic does not print.
- Rank 7 is labelled “Storage” on the graphic and “File Management” in Visual Capitalist’s table [1]. Both mean cloud storage apps such as Google One.
- Visual Capitalist’s article says dating apps pulled in close to $6 billion “in 2024” [1]; the chart’s figure, $5.7 billion, is for 2023.
- Two icons (one in rank 3 and one in rank 5) could not be identified with confidence and are described rather than named.
Questions about app consumer spending in 2023
Which type of app do people spend the most money on?
Digital entertainment apps, such as Netflix and Disney+, took the most consumer spending in 2023, at $8.2 billion. Dating apps were second with $5.7 billion and short video apps third with $4.3 billion. The figures come from Sensor Tower's State of Mobile 2024, are global and include the commission app stores take. Mobile games are not included in the ranking.
How much do people spend on dating apps?
People spent $5.7 billion on dating apps in 2023, making dating the second biggest app category for consumer spending. Visual Capitalist says Tinder was the first non-game app to reach $1 billion in user spending, in 2020 [1]. It reports that about 11% of Tinder's users are paying members and that they account for about 60% of its revenue [1].
Why do people pay for apps?
People pay to remove adverts, reach content behind paywalls or get a more exclusive service, according to Visual Capitalist, even though many useful apps such as email, messaging and social media cost nothing [1]. Media access is the common thread in the 2023 ranking, from live sports and music to comics and books [1]. Dating apps charge either to see more profiles or to boost a user's profile [1].
Did global consumer spending on apps rise in 2023?
Yes, Sensor Tower's State of Mobile 2024 says global consumer spending rose 4% in 2023 after a 2% fall in 2022 [2]. Apps held up while spending in games was squeezed by inflation [2]. The same report found that the weighted average time spent on mobile across the top 10 markets passed five hours in 2023, up 2% on the year before [2].
Sources
- Pallavi Rao, What Types of Apps Do People Actually Pay For?, Visual Capitalist, 11 December 2024. The publisher’s post of this chart.
- Sensor Tower, State of Mobile 2024. Data source named on the graphic.
Last reviewed 30 October 2026