What is the crypto market cap today?
On 10 November 2026 CoinMarketCap put the total crypto market cap at about $2.51 trillion, and CoinGecko, which tracks a slightly different set of coins, had $2.52 trillion [1][2]. Bitcoin was worth about $1.50 trillion of that, close to 60%, and Ethereum about $259 billion, a little over 10% [1][2].
That is well below the record. Total crypto market cap peaked at about $4.28 trillion on 7 October 2025 in CoinMarketCap’s daily data, the day after Bitcoin’s all time high price of $126,080 [1][2]. The market is now roughly 41% below that peak (our arithmetic). Bitcoin is down by about the same amount from its high, and Ethereum, which peaked at $4,946 in August 2025, has lost more than half its value [2].
Crypto prices move every minute, so treat any figure on this page as a snapshot. The live totals are on CoinMarketCap and CoinGecko [1][2].
What crypto market cap means
A coin’s market cap is its price multiplied by the number of coins in circulation. If a coin trades at $10 and 1 million are in circulation, its market cap is $10 million. Total crypto market cap is that figure added up across every coin a data site tracks, which runs to thousands of tokens [3].
A few things are worth knowing before you read too much into it.
- It is a paper value, not money invested. The figure moves with the last traded price, so a small amount of buying or selling in a thinly traded coin can add or remove billions from its market cap.
- Circulating supply is not the same as total supply. Many tokens have large amounts locked up or still to be released. Sites also show a fully diluted value, which uses the maximum supply instead, and that can be much higher [3].
- Different sites give different totals. CoinMarketCap and CoinGecko include different coins and apply their own rules on which prices and supplies to count, so their totals usually differ by a few per cent [1][2].
- Bitcoin dominance is Bitcoin’s share of the total. A rising figure usually means money is moving into Bitcoin from smaller coins, which traders read as caution [1].
How the crypto market cap has grown since 2013
CoinMarketCap’s records start in April 2013, when the whole market was worth about $1.6 billion [1]. Growth since then has come in sharp bursts, each followed by a large fall. These are the main turning points in its daily data [1].
| Date | Total crypto market cap | What was happening |
|---|---|---|
| April 2013 | $1.6 billion | Start of the records, almost all Bitcoin |
| End of 2016 | $17.7 billion | Before the first big boom |
| 8 January 2018 | $829 billion | Peak of the 2017 boom in Bitcoin and new tokens |
| December 2018 | $102 billion | Low after an 88% fall |
| 9 November 2021 | $2.92 trillion | Peak of the 2020 to 2021 boom |
| 22 November 2022 | $788 billion | Low after the collapse of Terra and the FTX exchange |
| End of 2024 | $3.25 trillion | Up 97% in the year |
| 7 October 2025 | $4.28 trillion | Record high so far |
| 10 November 2026 | $2.51 trillion | About 41% below the record |
The pattern is easy to see. Each boom took the market far above the last one, and each crash took away 70% or more of its value. The 2018 fall was 88% from peak to low and the 2022 fall was 73% (our arithmetic from CoinMarketCap’s daily figures) [1]. Even so, every low has been higher than the low before it.
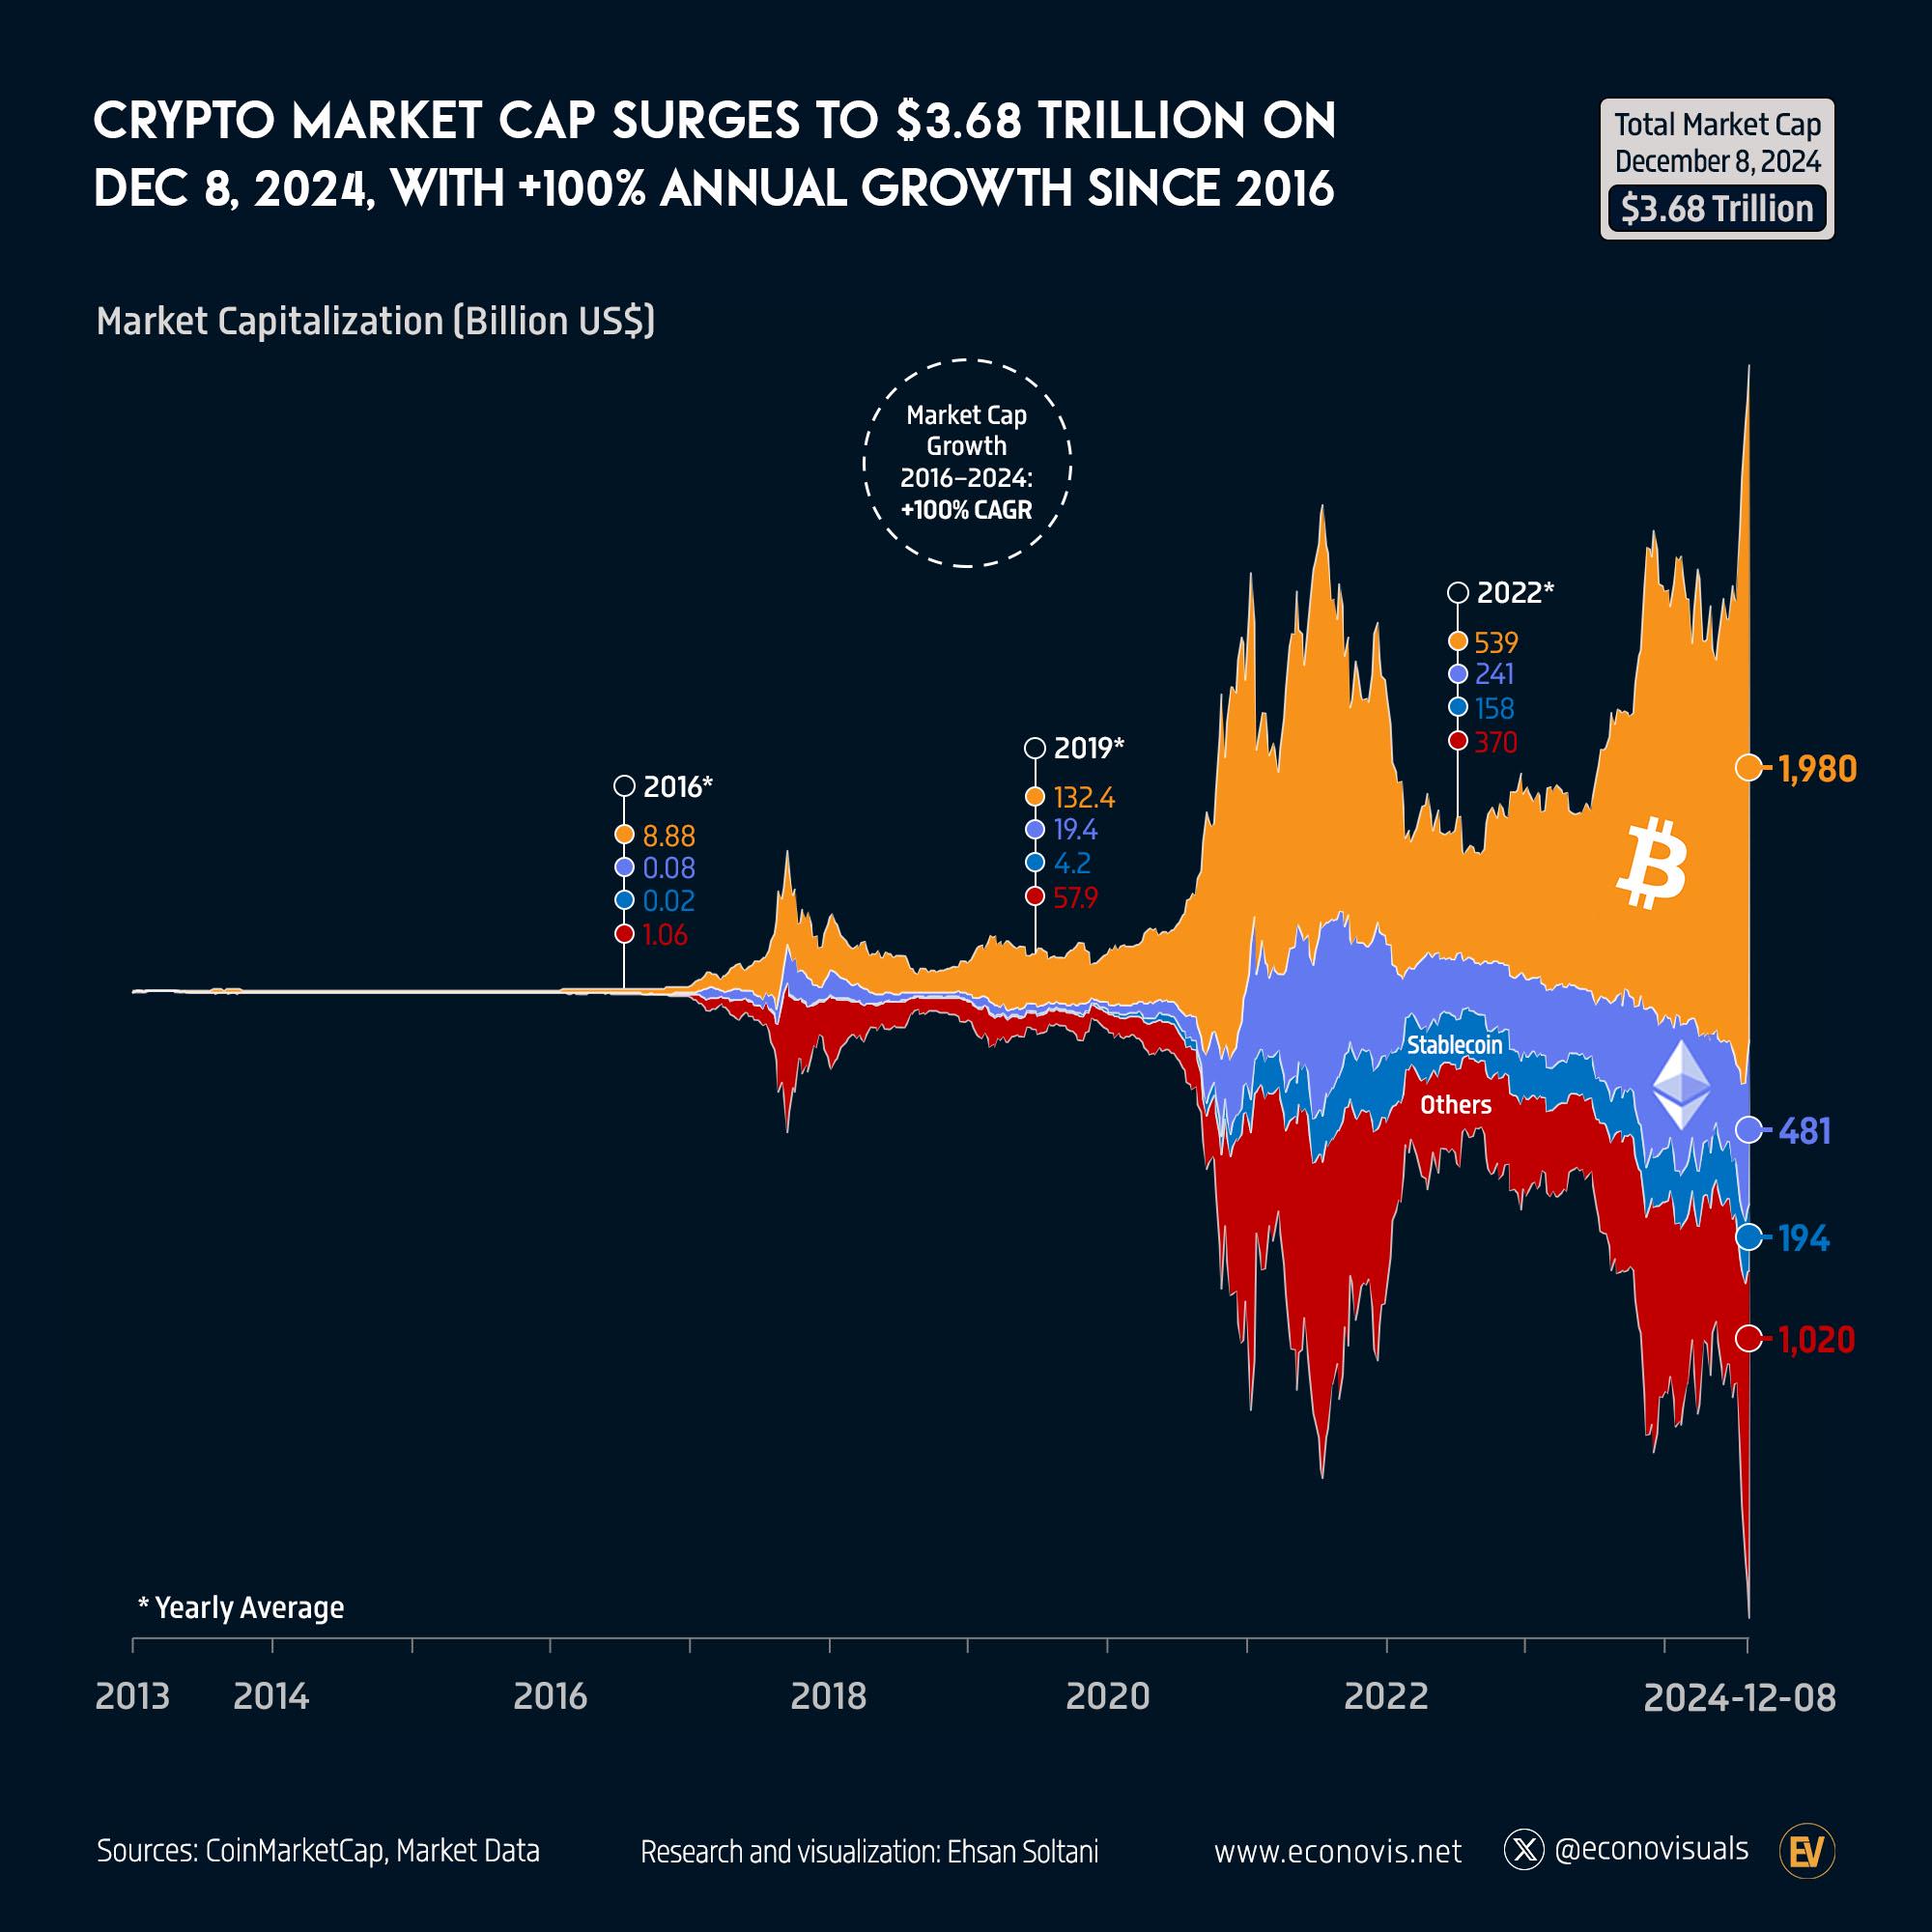
In 2024 alone the market rose from $1.65 trillion to $3.25 trillion, a gain of about $1.6 trillion or 97%, the same figure Econovis reported from CoinMarketCap data [1][4]. Much of that came after the US Securities and Exchange Commission approved the first spot Bitcoin exchange traded products in January 2024, which let ordinary investors buy Bitcoin exposure through a normal brokerage account [5].
Has crypto really doubled every year?
The infographic by Econovis puts growth since 2016 at about 100% a year on average. That checks out. The market averaged around $10 billion through 2016 and reached $3.65 trillion on 8 December 2024 in CoinMarketCap’s data, more than 300 times larger in about eight and a half years [1]. Over that span, 100% a year (doubling every year) is the right compound rate (our arithmetic).
The average hides how uneven the path was. Most of the growth came in a handful of short periods, mainly 2017, late 2020 to 2021 and 2024, while 2018 and 2022 wiped out most of the gains of the year before. Starting from a market of only $10 billion also flatters the rate. If you start the clock at the 2021 peak instead, the market was only about 25% bigger on 8 December 2024 than it had been three years earlier, and by November 2026 it was smaller (our arithmetic) [1].
So the long run growth is real, but no one should treat 100% a year as something to expect. Past growth in crypto has said little about the next year.
Bitcoin, Ethereum, stablecoins and other coins
The Econovis chart splits the market into four parts, and that split is still the easiest way to understand what the total is made of.
| Segment | 8 December 2024 (Econovis) | Share then | Share in November 2026 |
|---|---|---|---|
| Bitcoin | $1,980 billion | 54% | About 60% |
| Ethereum | $481 billion | 13% | About 10% |
| Stablecoins | $194 billion | 5% | About 12% |
| All other coins | $1,020 billion | 28% | About 18% |
November 2026 shares are our arithmetic from CoinGecko’s totals and DefiLlama’s stablecoin figure, so they are approximate [2][6].
Bitcoin
Bitcoin has been the largest single crypto asset for the whole history of the market. Its supply is capped at 21 million coins, and about 20.1 million are already in circulation [2]. Its share of the total has risen from below 40% at the end of 2022 to about 60%, so Bitcoin has gained far more of the market’s value than smaller tokens in this cycle [1].
Ethereum
Ethereum is the second largest asset and the main network for other tokens and applications. Its share has slipped from about 13% in late 2024 to about 10% now, and its price has fallen further from its peak than Bitcoin’s [1][2].
Stablecoins
Stablecoins are tokens designed to hold a fixed value, usually one US dollar, backed by cash and short term government debt. Their market cap does not swing with prices in the way other coins do. It grows when people mint more of them. DefiLlama puts the total at about $290 billion, up from $194 billion in the Econovis chart, with Tether’s USDT making up about 61% [6]. Because their value stays put while the rest of the market falls, stablecoins now make up a much larger share of the total than they did in 2024.
Other coins
Everything else, from large networks such as Solana and XRP to thousands of small tokens, makes up the rest. This part of the market tends to rise fastest in booms and fall hardest in crashes.
Why the crypto market cap rises and falls so quickly
Crypto has no earnings or dividends to anchor its price, so its value rests on what buyers will pay, and that changes fast. A few forces have driven most of the big moves since 2013.
- Interest rates and the wider market. The 2021 boom came when rates were close to zero, and the 2022 crash came as central banks raised them quickly.
- Access for investors. Exchange traded products in the US and elsewhere have made it far easier for funds and ordinary investors to buy in [5].
- Failures inside crypto. The collapse of the Terra stablecoin in May 2022 and the FTX exchange in November 2022 each knocked hundreds of billions of dollars off the total. In the week of the Terra collapse alone, the market fell from about $1.8 trillion to $1.26 trillion [1].
- Leverage. Many traders borrow to buy, so a falling price can force sales that push it down further.
Questions about crypto market cap
What is the total crypto market cap right now?
About $2.5 trillion on 10 November 2026, according to CoinMarketCap and CoinGecko [1][2]. It changes constantly, so check either site for the live figure.
What was the highest crypto market cap ever?
About $4.28 trillion on 7 October 2025 in CoinMarketCap’s daily data. The previous record was about $2.92 trillion in November 2021 [1].
Is a higher market cap better in crypto?
A higher market cap usually means a coin is more widely held and easier to buy and sell without moving the price. It does not mean the coin is better value or safer. A coin with a small market cap can rise faster, but it can also fall to almost nothing.
Why is the crypto market down?
The market has been falling since its October 2025 peak and was about 41% lower in November 2026 [1]. Falls like this have happened after every boom. Any single day’s drop usually comes from a mix of wider market selling, large holders taking profits and leveraged traders being forced to sell.
Is crypto market cap the same as money invested in crypto?
No. Market cap values every coin at the latest price. The amount of money that actually went in is much smaller, and nobody could sell every coin at today’s price.
How much of the crypto market is Bitcoin?
About 60% in November 2026, up from 54% in the Econovis chart of December 2024 [1][2].
Sources
- CoinMarketCap, Global cryptocurrency charts, total market cap and Bitcoin dominance, daily data from April 2013 to 10 November 2026.
- CoinGecko, Global cryptocurrency market cap charts and coin data for Bitcoin and Ethereum, 10 November 2026.
- CoinMarketCap, Methodology, market capitalisation, circulating supply and fully diluted value.
- Econovis, Crypto Market Cap Hits $3.25 Trillion in 2024, Doubling Annually Since 2016, Voronoi, 6 January 2025, and Crypto Market Capitalization Approaches Apple’s in December 2024.
- US Securities and Exchange Commission, Statement on the approval of spot bitcoin exchange traded products, 10 January 2024.
- DefiLlama, Stablecoins by market cap, 10 November 2026.
Last reviewed 10 November 2026