Key figures
- Medicinal and pharmaceutical products are the largest labelled category of European Union exports to the US, at €112.6 billion in the 12 months to September 2024, up from €6.9 billion in 2000.
- Mechanical and industrial machinery (€90.4 billion) and automotive and transport equipment (€77.2 billion) come next.
- Those three categories make up about half of EU exports to the US, as the subtitle says.
- Electronic and electrical equipment adds €44.6 billion; four smaller categories are each between €21 billion and €25 billion.
- The flow dips at the 2008 financial crisis and the 2020 pandemic and rises steeply from 2021.
All figures are from the graphic, which cites Eurostat.
European Union exports to the US by product, 2000 and 2024
Title: European Union Exports to the U.S.: Key Product Categories. Subtitle: Pharmaceuticals, Machinery, and Automotive Comprise Half of EU Exports to the U.S. Measure: Exports (Billion Euro, 12-Month Rolling Sum). The chart is a streamgraph from 2000 to September 2024, with each band’s thickness showing the value of one category. Values are printed only at the start and end of each band.
| Category | 2000 (€ billion) | 2024-09 (€ billion) |
|---|---|---|
| Medicinal and Pharmaceutical Products | 6.9 | 112.6 |
| Mechanical and Industrial Machinery | 27.7 | 90.4 |
| Automotive and Transport Equipment | 31.2 | 77.2 |
| Electronic and Electrical Equipment | 17.8 | 44.6 |
| Food and Beverages | 6.8 | 24.7 |
| Metals and Articles | 7.8 | 24.5 |
| Professional, Scientific and Controlling Instruments | 4.5 | 22.6 |
| Organic and Inorganic Chemicals | 9.9 | 21.4 |
| Rest of Goods | 39.5 | 112.6 |
Events marked on the chart: 2008, Global Financial Crisis; 2020, COVID-19 Pandemic; 2022-02, Russian invasion of Ukraine. Footer: Source: Eurostat. www.econovis.net, @econovisuals. Voronoi, Where Data Tells the Story.
How big EU exports to the US are
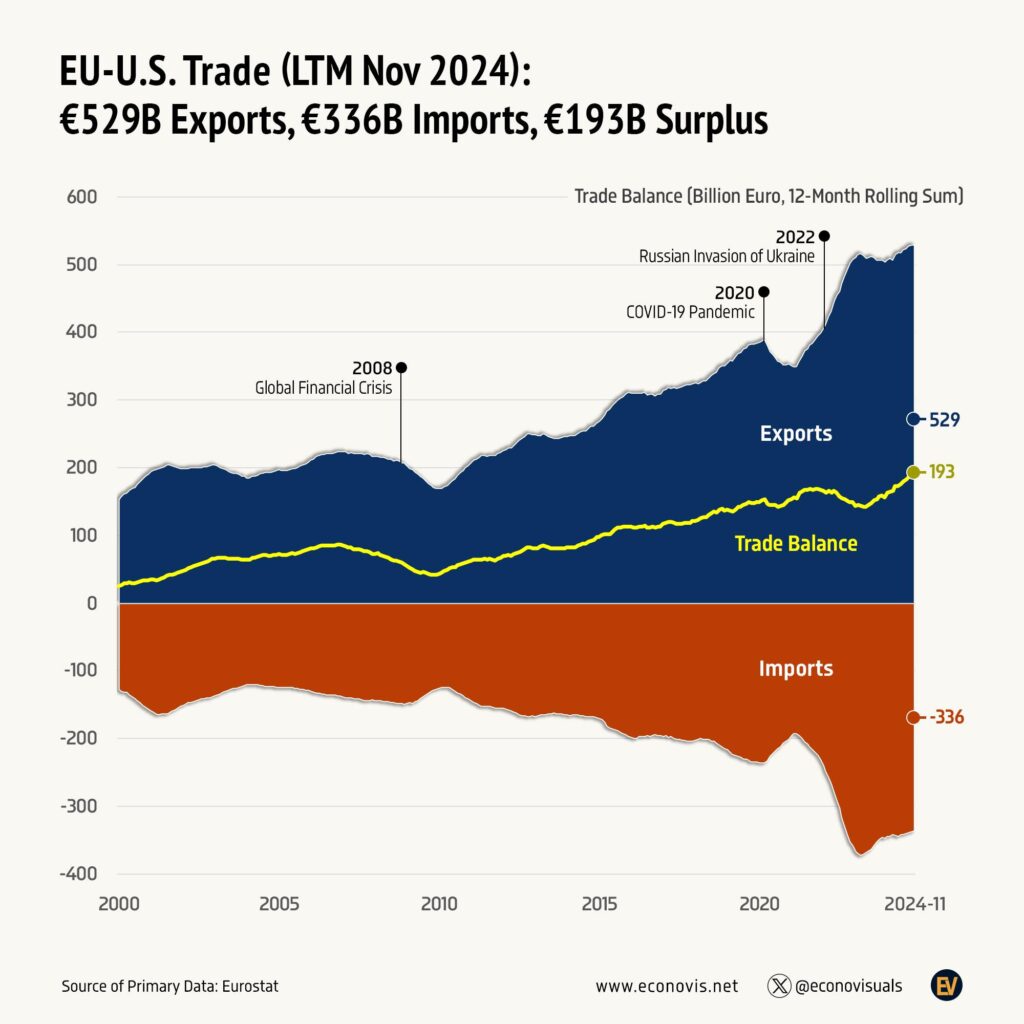
In its post with the chart, Econovis puts EU exports to the US at €527 billion ($571 billion) in the 12 months to September 2024. It gives the shares of the main categories as pharmaceuticals 21.4%, machinery 17.1%, automotive and transport equipment 14.7% and electronic and electrical equipment 8.5%, together 62% of the total [1].
The Council of the EU reports that EU goods exports to the US reached €554.6 billion in 2025, against €356.2 billion of imports from the US, and that 21% of EU goods exports go to the US, making it the EU’s top export market [2]. Its list of top EU goods exports to the US starts with medicinal and pharmaceutical products, road vehicles, and general industrial machinery [2].
Notes on this infographic
- The nine labelled end values add up to €530.6 billion by our arithmetic, slightly more than the €527 billion total in the creator’s post [1]; the difference is likely rounding in the labels.
- Pharmaceuticals and Rest of Goods are both labelled 112.6. We checked this at full resolution; the two bands are drawn at a similar thickness, so we have kept the graphic’s figures.
- By our arithmetic, the three categories in the subtitle sum to €280.2 billion, 53% of the labelled total, which supports “half”.
- Values are in euros and are 12 month rolling sums, so the 2024-09 figure covers October 2023 to September 2024.
Questions about European Union exports
What are the major exports of the European Union to the US?
Medicinal and pharmaceutical products, machinery, and vehicles and transport equipment are the largest, according to the chart and the Council of the EU [2].
What does the EU import from the US?
The Council of the EU lists petroleum products, medicinal and pharmaceutical products, and power generating machinery as the top goods the EU imports from the US, worth €356.2 billion in total in 2025 [2].
How much does the EU export to the US?
Econovis puts EU exports to the US at €527 billion ($571 billion) in the 12 months to September 2024 [1]. The Council of the EU reports that EU goods exports to the US reached €554.6 billion in 2025 [2]. It also says 21% of EU goods exports go to the US, making it the EU's top export market [2].
How much have EU pharmaceutical exports to the US grown?
EU exports of medicinal and pharmaceutical products to the US rose from €6.9 billion in 2000 to €112.6 billion in the 12 months to September 2024, according to the chart, which cites Eurostat. That makes them the largest labelled category, at 21.4% of EU exports to the US in the creator's figures [1]. Mechanical and industrial machinery is next at €90.4 billion.
Sources
- Econovis, European Union Exports to the U.S.: Key Product Categories, 4 January 2025 (original post).
- Council of the European Union, EU-US trade (infographic and text version, 2025 data).
Last reviewed 30 October 2026