Key figures from the CBO infographic
- Federal outlays in fiscal year 2023 were $6.1 trillion, or 22.7% of GDP.
- Revenues were $4.4 trillion, or 16.5% of GDP.
- The deficit was $1.7 trillion, equal to 6.3% of GDP, against a 50 year average of 3.7%.
- Debt held by the public was 97% of GDP at the end of 2023, and net interest costs rose 87% between 2021 and 2023.
- All figures are from the graphic, which cites Congressional Budget Office data from March 2024.
The federal budget 2023 in text
The infographic is titled “The Federal Budget in Fiscal Year 2023”. Fiscal year 2023 ran from 1 October 2022 to 30 September 2023.
Total outlays
| Category | Item | Amount | Share of GDP |
|---|---|---|---|
| Mandatory | Social Security | $1.3 trillion | 5.0% |
| Mandatory | Medicare | $839 billion | 3.1% |
| Mandatory | Medicaid | $616 billion | 2.3% |
| Mandatory | Income security programs | $448 billion | 1.7% |
| Mandatory | Other | $502 billion | 1.9% |
| Mandatory | Total mandatory | $3.8 trillion | 13.9% |
| Discretionary | Nondefense | $917 billion | 3.4% |
| Discretionary | Defense | $805 billion | 3.0% |
| Discretionary | Total discretionary | $1.7 trillion | 6.4% |
| Net interest | Net interest | $659 billion | 2.4% |
| Total outlays | $6.1 trillion | 22.7% |
Callouts on the graphic explain three items. Other mandatory outlays include federal civilian and military retirement, some veterans’ benefits and other mandatory programmes, minus offsetting receipts other than those for Medicare. Nondefense outlays pay for programmes related to veterans’ health care, education and transportation, certain health and income security programmes, and other activities. Medicare outlays are benefit payments less premiums and other offsetting receipts.
Total revenues
| Source | Amount | Share of GDP |
|---|---|---|
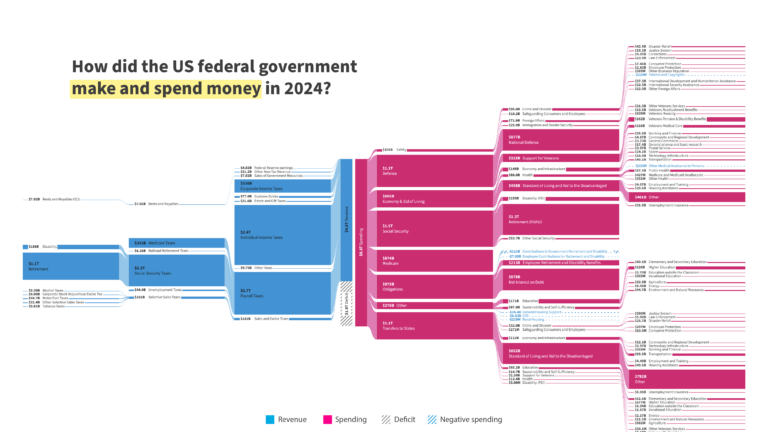
| Individual income taxes | $2.2 trillion | 8.1% |
| Payroll taxes | $1.6 trillion | 6.0% |
| Corporate income taxes | $420 billion | 1.6% |
| Other | $229 billion | 0.8% |
| Total revenues | $4.4 trillion | 16.5% |
Other revenues include customs duties, excise taxes, estate and gift taxes, miscellaneous fees and fines, and remittances from the Federal Reserve. Payroll taxes fund social insurance programmes, mainly Social Security and Medicare’s Hospital Insurance programme.
Categories of the budget
- Mandatory spending: mainly payments for benefit programmes whose eligibility rules and benefit formulas are set by law.
- Discretionary spending: spending that lawmakers control each year through appropriation acts.
- Net interest: the government’s interest payments on debt held by the public, offset by interest income the government receives.
- Revenues: taxes and other money collected from the public through the government’s sovereign powers.
Deficits and debt
| Measure | Figure |
|---|---|
| Deficit in 2023 | 6.3% of GDP |
| Average deficit over the past 50 years | 3.7% of GDP |
| Deficit in 2023 | $1.7 trillion |
| Debt held by the public at the end of 2023 | 97% of GDP |
| Change in net interest costs from 2021 to 2023 | 87% increase |
Two line charts cover 1974 to 2023. The first shows federal deficits or surpluses as a percentage of GDP, with a dashed line for the 3.7% average deficit. The second shows federal debt held by the public as a percentage of GDP, with a dashed line for the 48.3% average. The graphic defines the annual deficit as the amount by which outlays exceed revenues, financed by Treasury borrowing from individuals, businesses, the Federal Reserve and other countries. Debt held by the public finances annual deficits, the Treasury’s cash balances and federal loans, and surpluses can be used to pay it down.
Footer: prepared by Dan Ready, Jorge Salazar and Caitlin Verboon. Data source: Congressional Budget Office, March 2024. Amounts are the actual amounts reported in CBO’s “The Accuracy of CBO’s Budget Projections for Fiscal Year 2023” (December 2023). Numbers may not add up to totals because of rounding.
How the deficit compares with the Treasury’s figures
CBO published this infographic on 5 March 2024 with the summary that the 2023 deficit was $1.7 trillion, equal to 6.3% of GDP [1]. It released separate infographics on mandatory spending, discretionary spending and revenues on the same day [1].
The Treasury’s Financial Report of the US Government for fiscal year 2023 gives the same deficit. It says the budget deficit increased by $319.7 billion (23.2%) to $1.7 trillion [2]. The Treasury report also uses accrual measures that the CBO graphic does not, such as net operating cost, which fell to $3.4 trillion [2]. Those are different measures from the cash based outlays and revenues on this page, so the two sets of totals should not be mixed.
Notes on this infographic
- Rounding. The five mandatory items add up to about $3.7 trillion against the printed total of $3.8 trillion, because Social Security is rounded to $1.3 trillion. CBO’s footer warns that numbers may not add up to totals.
- Markup on our copy. A hand drawn yellow line crosses the payroll taxes ring. It is not part of CBO’s design.
- Actual figures, not a proposal. This shows what was spent and collected in fiscal year 2023. It is not the President’s budget request for 2023.
- Line charts. The two charts print no yearly values apart from the averages, so we have not added any.
Questions about the federal budget 2023
What was the federal budget in 2023?
According to CBO, federal outlays in fiscal year 2023 were $6.1 trillion and revenues were $4.4 trillion, leaving a deficit of $1.7 trillion, or 6.3% of GDP [1].
How is the federal budget divided?
The graphic splits spending into three parts: mandatory spending ($3.8 trillion, mostly Social Security, Medicare and Medicaid), discretionary spending ($1.7 trillion, split between nondefense and defense) and net interest ($659 billion).
How much did the US government pay in interest on its debt in 2023?
Net interest cost the federal government $659 billion in fiscal year 2023, equal to 2.4% of GDP, according to CBO. Net interest costs rose 87% between 2021 and 2023. Debt held by the public stood at 97% of GDP at the end of 2023, against an average of 48.3% over 1974 to 2023 shown on the graphic.
Where does US federal government revenue come from?
Individual income taxes were the largest source in fiscal year 2023, bringing in $2.2 trillion, or 8.1% of GDP. Payroll taxes raised $1.6 trillion (6.0%), corporate income taxes $420 billion (1.6%) and other sources $229 billion (0.8%), for total revenues of $4.4 trillion. Payroll taxes mainly fund Social Security and Medicare's Hospital Insurance programme, and other revenues include customs duties, excise taxes and remittances from the Federal Reserve.
Sources
- Congressional Budget Office, The Federal Budget in Fiscal Year 2023, An Infographic, 5 March 2024 (publication page cbo.gov/publication/59727; read via the Wayback Machine copy of 12 March 2024 because cbo.gov blocked our request).
- US Treasury, Bureau of the Fiscal Service, Financial Report of the US Government, FY 2023, Results in brief.
Last reviewed 29 October 2026