Which countries consume the most fossil fuels?
China is by far the largest consumer of fossil fuels. In 2023 it used 140 exajoules of coal, oil and natural gas, almost twice the 76 exajoules used by the United States, according to the Energy Institute’s 2024 Statistical Review of World Energy [1][2]. India was third with 35 exajoules and Russia fourth with 27. The twelve biggest consumers together used about 359 exajoules, more than double the 146 exajoules used by every other country combined (our arithmetic from the chart’s figures) [1].
Fossil fuels still dominate world energy. In 2023 they supplied 77% of the world’s primary energy consumption and over 60% of its electricity [3].
Fossil fuel consumption by country in 2023
| Rank | Country | Fossil fuel consumption (exajoules) | Main fuel |
|---|---|---|---|
| 1 | China (incl. Hong Kong) | 140 | Coal |
| 2 | United States | 76 | Oil and natural gas |
| 3 | India | 35 | Coal |
| 4 | Russia | 27 | Natural gas |
| 5 | Japan | 15 | Mixed |
| 6 | Saudi Arabia | 12 | Oil and natural gas |
| 7 | Iran | 12 | Natural gas |
| 8 | South Korea | 10 | Mixed |
| 9 | Germany | 9 | Mixed |
| 10 | Indonesia | 9 | Coal |
| 11 | Canada | 9 | Natural gas and oil |
| 12 | United Kingdom | 5 | Oil and natural gas |
| Rest of the world | 146 | Mixed |
Totals from Elements by Visual Capitalist, using Energy Institute data [1][2]. The main fuel column is our reading of the chart’s coloured bars, which give no figures for each fuel.
Why China uses so much fossil fuel
China’s total reflects the size of its population, second only to India’s [5], and of its economy. Most of its fossil energy comes from coal, as the chart’s bars show. China and the US together accounted for about 43% of the fossil fuels on the chart, 216 of the 505 exajoules shown (our arithmetic) [1].
India follows a similar coal-heavy pattern at a much smaller scale per person. Its 35 exajoules is less than half the US figure, for a population more than four times as large [5].
How fuel mixes differ between countries
The chart shows how differently countries meet their energy needs. Coal dominates in China, India and Indonesia, which have large domestic coal reserves. Natural gas is the biggest part for Russia and Iran, both major gas producers. Saudi Arabia burns oil and gas with almost no coal. The United States and Canada rely mostly on oil and gas, with a thin layer of coal, and the UK has nearly phased coal out of its mix [1].
The mix matters for the climate because the fuels are not equally dirty. Burning coal releases more carbon dioxide for each unit of energy than oil, and oil more than natural gas, so a country switching from coal to gas cuts emissions even if its fossil fuel consumption stays the same.
Total use versus use per person
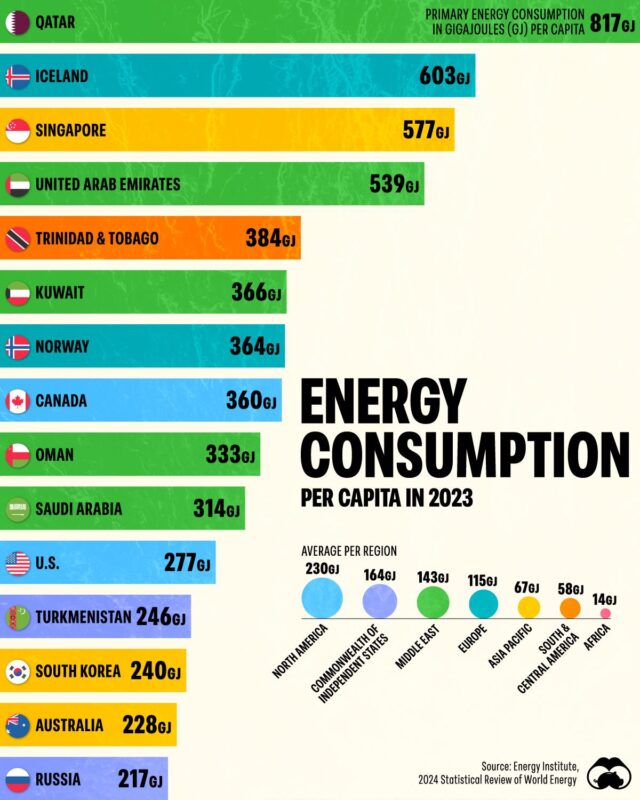
A ranking of totals mostly reflects how big a country is. Readers of the chart pointed out that a per person measure would compare countries more fairly [4]. Using UN population estimates for 2024 [5], the US used about 221 gigajoules of fossil fuel per person, China about 99 and India about 24 (our rough arithmetic). So the average American used more than twice as much as the average Chinese resident and about nine times as much as the average Indian, even though China’s total is far higher.
What is an exajoule?
An exajoule is a billion billion joules, a unit used for national and global energy statistics. The chart gives a handy conversion: one exajoule equals about 174 million barrels of oil equivalent [1]. On that basis China’s 140 exajoules equal roughly 24.4 billion barrels of oil equivalent in a year, and the UK’s 5 exajoules about 0.9 billion (our arithmetic).
Is fossil fuel use still rising?
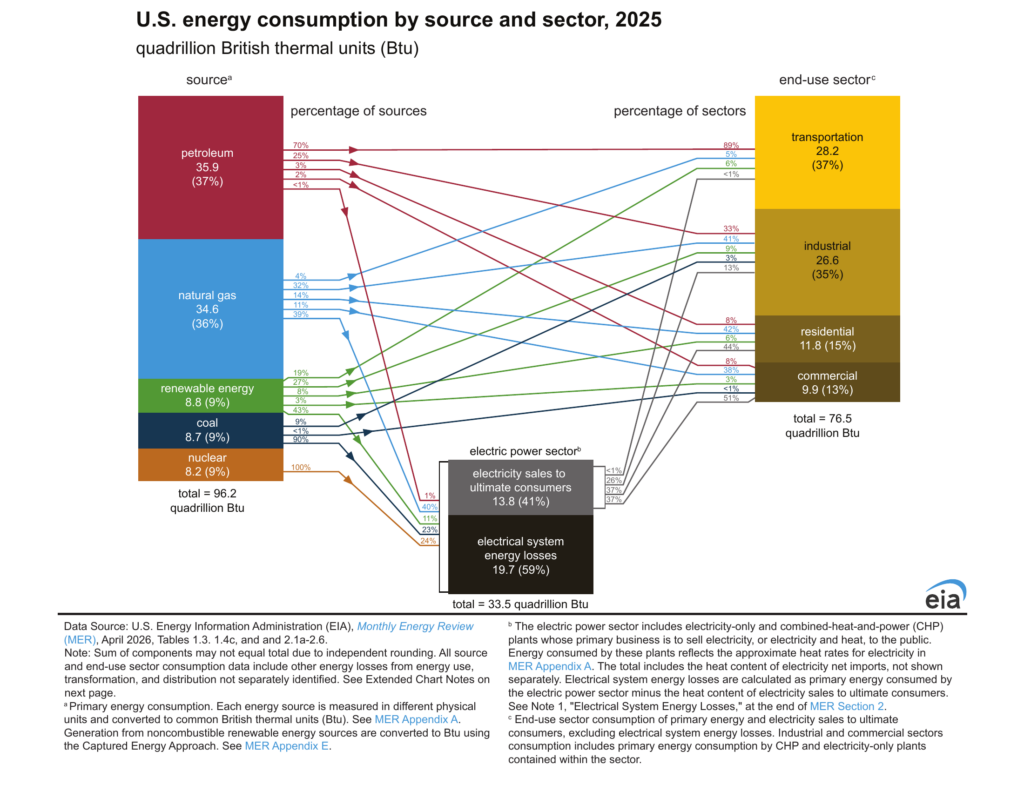
Yes, though more slowly than clean energy. The Energy Institute’s 2026 Statistical Review, covering 2025, reported record total energy demand, up 1.7%, with every major energy source, fossil fuels included, at an all-time high for the second year running [2]. Renewables were the largest source of growth in energy supply for the first time outside a recession, and solar generation rose 30% [2]. US emissions grew 3.2% that year, driven by a 13% rise in coal-fired power [2]. So the 2023 ranking on the chart still gives a fair picture: the same countries use the most, and total use has kept edging up.
Questions about fossil fuel consumption
Which country consumes the most fossil fuels?
China, with 140 exajoules in 2023, nearly twice the United States’ 76 exajoules [1].
How much of the world’s energy comes from fossil fuels?
About 77% of primary energy consumption in 2023, and over 60% of electricity [3].
How much fossil fuel does the US consume?
76 exajoules in 2023, mostly oil and natural gas, the second highest total after China [1].
How much fossil fuel does the UK use?
5 exajoules in 2023, mostly oil and natural gas with very little coal, the smallest total of the twelve countries on the chart [1].
How many barrels of oil are in an exajoule?
About 174 million barrels of oil equivalent [1].
Sources
- Elements by Visual Capitalist, Top Countries by Fossil Fuel Consumption in 2023, the original chart (data from the Energy Institute 2024 Statistical Review of World Energy and Business Insider).
- Energy Institute, Statistical Review of World Energy, read 2 November 2026.
- Wikipedia, Fossil fuel.
- u/sliceshot_, Top Countries by Fossil Fuel Consumption, r/IndiaStatistics, a repost of the chart with reader comments.
- United Nations, Population Division, World Population Prospects 2024, Summary of Results.
Last reviewed 2 November 2026