Where did US imports come from in 2023?
In 2023 Mexico was the largest source of goods imported into the United States. On the US Census Bureau’s figures, the US imported $3,084.1 billion of goods that year, and the top three suppliers were Mexico ($475.6 billion, 15.4%), China ($427.2 billion, 13.9%) and Canada ($421.1 billion, 13.7%) [2]. Taken as one bloc, the European Union supplied more than any single country.
The Econovis map above, which combines Census, UN Comtrade and WTO data, puts total US imports slightly higher at $3,173 billion, with Mexico on $480 billion, China $448 billion and Canada $431 billion [1]. The order is the same on both measures.
Top 10 countries the US imports from
| Rank | Country | US goods imports, 2023 | Share of total |
|---|---|---|---|
| 1 | Mexico | $475.6 billion | 15.4% |
| 2 | China | $427.2 billion | 13.9% |
| 3 | Canada | $421.1 billion | 13.7% |
| 4 | Germany | $159.7 billion | 5.2% |
| 5 | Japan | $147.3 billion | 4.8% |
| 6 | South Korea | $116.2 billion | 3.8% |
| 7 | Vietnam | $114.4 billion | 3.7% |
| 8 | Taiwan | $87.8 billion | 2.8% |
| 9 | India | $83.8 billion | 2.7% |
| 10 | Ireland | $82.3 billion | 2.7% |
Source: US Census Bureau, goods on a Census basis [2]. Shares for ranks 4 to 10 are our arithmetic from the Census totals.
Below the top ten, Econovis’s map shows Italy ($75 billion), the UK ($65 billion), France ($59 billion), Brazil ($41 billion) and the Netherlands ($39 billion), and Russia at just $4.9 billion [1].
Why Mexico became the top source of US imports
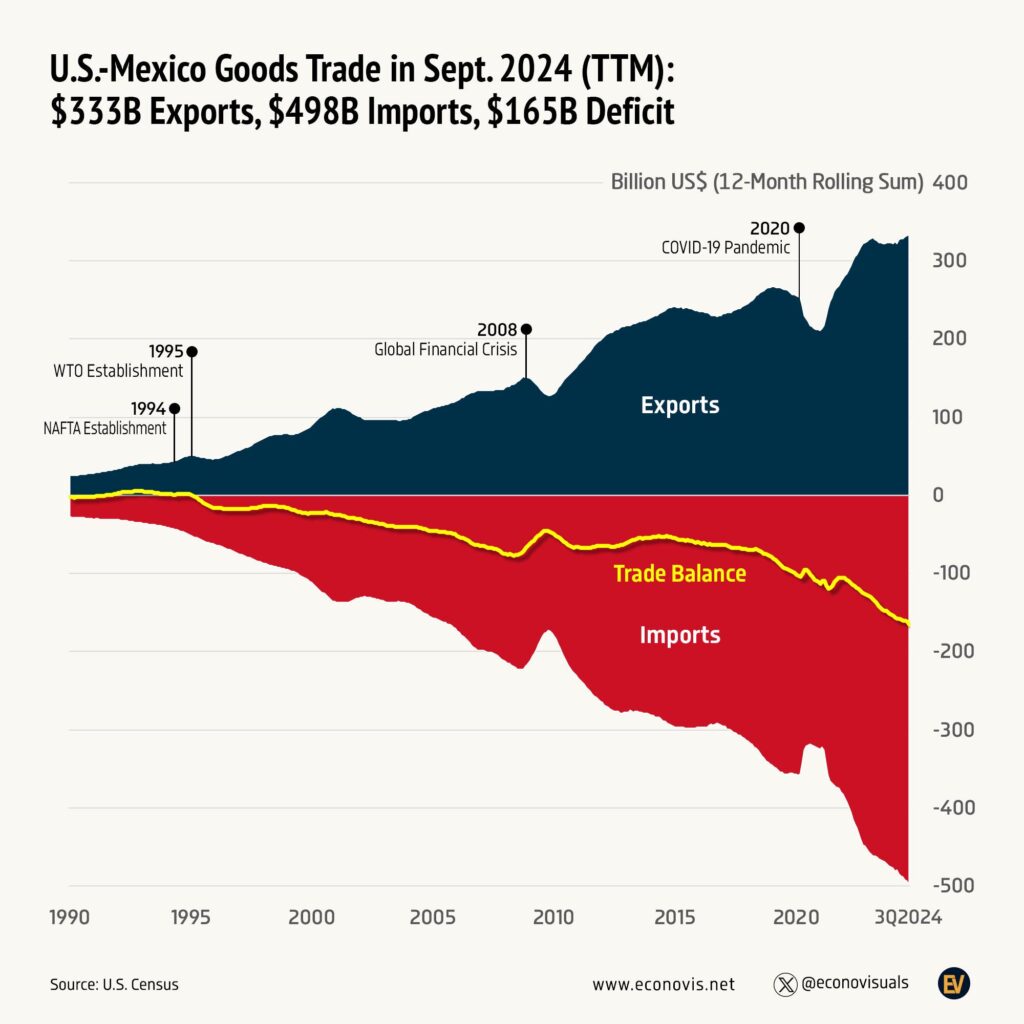
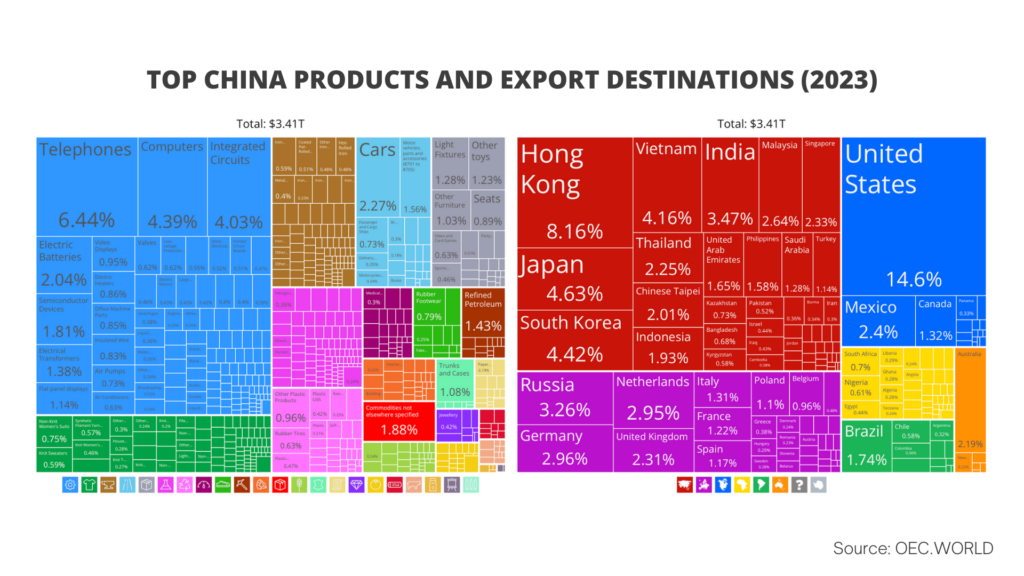
Mexico moved ahead of China in 2023 mainly because imports from China fell. The US goods deficit with China shrank by $102.9 billion to $279.4 billion during the year [3], and Census figures put China’s sales to the US about $48 billion below Mexico’s (our arithmetic) [2]. Mexico’s trade with the US runs under the United States-Mexico-Canada Agreement (USMCA), which replaced NAFTA on 1 July 2020 [4]; the Econovis map still calls Mexico and Canada “NAFTA partners” [1].
Counting exports and imports together, Mexico ($798.8 billion) was also the largest US trading partner overall in 2023, ahead of Canada ($774.3 billion) and China ($575.0 billion) [2]. Mexico and Canada between them supplied 28.7% of US imports on Econovis’s figures (our check of its arithmetic) [1].
How much the US imports from the EU
As a bloc, the 27 EU countries sold the US $590 billion of goods in 2023 on Econovis’s figures, 18.6% of the total and more than any single country [1]. Germany was the biggest EU supplier, followed by Ireland, Italy and France [1][2]. The US ran a goods deficit of $208.2 billion with the EU in 2023 [3].
What the US imports most
By broad category, the main US imports are consumer goods (such as phones, clothing, toys and medicines), capital goods (machinery, computers and equipment), industrial supplies (including crude oil, fuels and chemicals) and cars and car parts. In 2023 total goods imports fell by $158.4 billion on a Census basis [3]. Industrial supplies dropped $130.8 billion, led by crude oil, as energy prices eased, and consumer goods fell $80.7 billion, with lower spending on clothing, phones and toys. Cars bucked the trend: imports of vehicles, parts and engines rose $59.5 billion, including $41.1 billion more passenger cars, and pharmaceutical imports rose $13.6 billion [3].
Where the biggest US trade deficits are
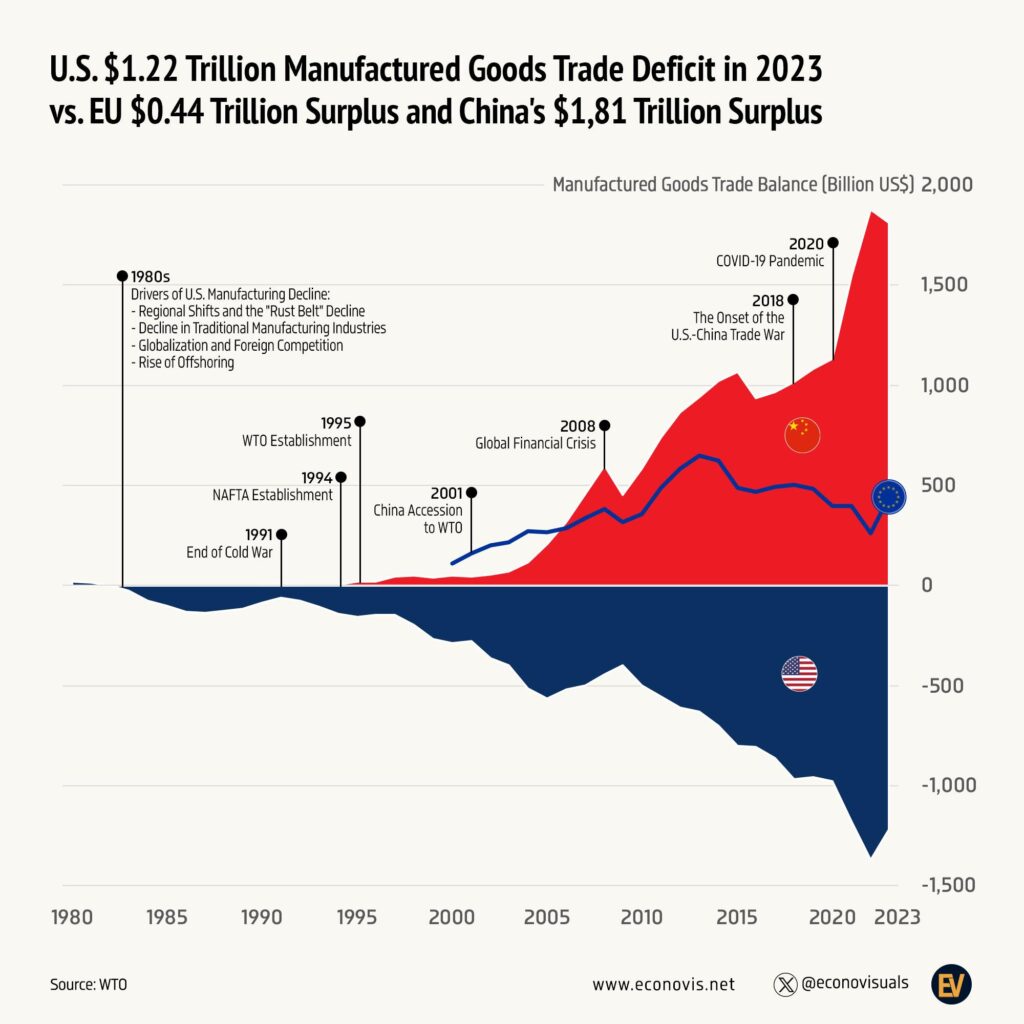
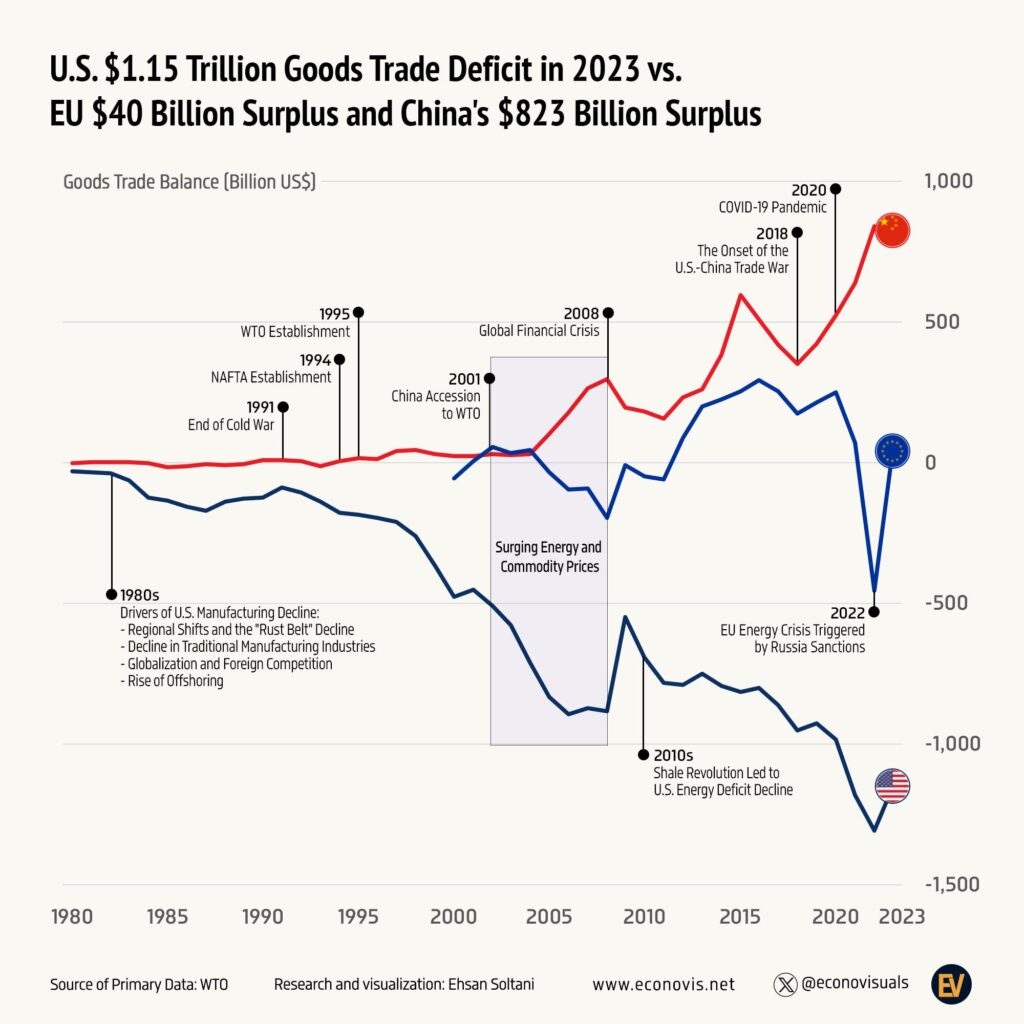
Importing more than it exports, the US ran its largest goods deficits in 2023 with China ($279.4 billion), the EU as a whole ($208.2 billion), Mexico ($152.4 billion) and Vietnam ($104.6 billion), followed by Germany, Japan, Canada and Ireland [3]. Vietnam stands out: it sells the US over $100 billion of goods a year while buying less than $10 billion back [2].
Why import totals differ between sources
You will see several totals for 2023 US imports, and they are all correct for what they measure. The Census Bureau’s $3,084.1 billion counts goods as they cross the border, by country of origin [2]. The Bureau of Economic Analysis adjusts those figures to a balance of payments basis, which follows changes of ownership rather than physical movement, giving $3,112.4 billion [3]. Econovis’s $3,173 billion combines Census data with UN Comtrade and WTO figures [1], which can use slightly different valuations. None of these include services such as travel or software, which the US also imports in large amounts. When comparing countries, stick to one source so the figures are on the same basis.
Questions about US imports by country
Which country exports the most to the US?
Mexico, with $475.6 billion of goods in 2023 on Census figures, just ahead of China ($427.2 billion) and Canada ($421.1 billion) [2].
How much did the US import in 2023?
$3,084.1 billion of goods on a Census basis [2], or $3,112.4 billion on a balance of payments basis [3]. Econovis’s combined figure is $3,173 billion [1].
Who is the largest trading partner of the US?
Mexico, with $798.8 billion of total trade in 2023, followed by Canada ($774.3 billion) and China ($575.0 billion) [2].
Is Mexico or China the bigger source of US imports?
Mexico was ahead of China as the largest source of US goods imports in 2023, a year in which imports from China fell sharply [2][3].
What are the top US imports?
By category, consumer goods, capital goods, industrial supplies such as crude oil, and cars and parts. Car imports grew fastest in 2023, rising $59.5 billion [3].
Sources
- Ehsan Soltani, Econovis, Leading Global Exporters to the U.S. in 2023, the original map.
- US Census Bureau, Top Trading Partners, December 2023 (year to date).
- Bureau of Economic Analysis and US Census Bureau, U.S. International Trade in Goods and Services, December and Annual 2023, 7 February 2024.
- Office of the United States Trade Representative, United States-Mexico-Canada Agreement.
Last reviewed 2 November 2026