How much natural gas does the world produce?
The world produced about 392.7 billion cubic feet of natural gas a day in 2023, according to Energy Institute data mapped by Ehsan Soltani of Econovis [1][2]. Over a year that is roughly 143 trillion cubic feet, or about 4,060 billion cubic metres (our conversion). Output has kept rising since: OPEC’s figures put world marketed production at 4.34 trillion cubic metres in 2025 [3].
Production is highly concentrated. On the 2023 figures the ten largest producers made about 73% of the world’s gas (our arithmetic from the map), and in 2025 the top five alone produced about 57% [1][3].
The largest natural gas producing countries
| Rank | Country | 2023, billion cubic feet per day | Share of world, 2023 (our arithmetic) |
|---|---|---|---|
| 1 | United States | 100.17 | 25.5% |
| 2 | Russia | 56.73 | 14.4% |
| 3 | Iran | 24.35 | 6.2% |
| 4 | China | 22.67 | 5.8% |
| 5 | Canada | 18.41 | 4.7% |
| 6 | Qatar | 17.51 | 4.5% |
| 7 | Australia | 14.68 | 3.7% |
| 8 | Norway | 11.28 | 2.9% |
| 9 | Saudi Arabia | 11.04 | 2.8% |
| 10 | Algeria | 9.82 | 2.5% |
Figures from the Econovis map, which cites the Energy Institute [1]. Malaysia (7.84) and Turkmenistan (7.38) come just below the top ten, followed by Indonesia, Egypt and the UAE. The UK produced 3.34 billion cubic feet a day [1].
The order was the same in 2025 for the top five on OPEC’s figures: the United States produced 1.12 trillion cubic metres, 26% of the world total, then Russia (625 billion), Iran (280 billion), China (256 billion) and Canada (218 billion) [3].
Why the United States leads natural gas production
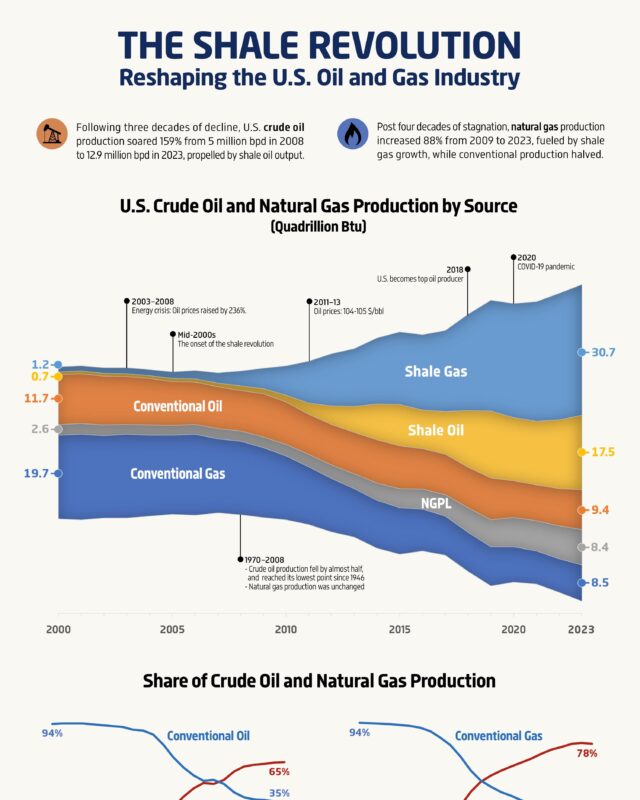
The US produces almost twice as much gas as Russia, about 1.8 times as much on the 2023 figures [1]. The reason is shale. The US Energy Information Administration (EIA) says most of the increase in US production since 2005 came from horizontal drilling and hydraulic fracturing in shale and other tight rock formations [4]. The technique was developed commercially in the Barnett Shale in Texas, where by 2000 Mitchell Energy had found a way to produce commercial volumes of shale gas [4].
US dry gas production reached a record of about 96.6 billion cubic feet a day in 2022, around 13% more than the country consumed that year [4]. Five states produced about 70% of it: Texas (24.6%), Pennsylvania (21.8%), Louisiana (9.9%), West Virginia (7.4%) and Oklahoma (6.7%) [4].
Natural gas production in Russia and the Middle East
Russia is the second-largest producer, with 56.73 billion cubic feet a day in 2023 [1]. The Middle East is the other big centre: on the map, Iran, Qatar, Saudi Arabia, the UAE and Oman together produced 62.46 billion cubic feet a day, about 16% of the world total (our arithmetic) [1]. Qatar, sixth in the world, produced more than five times as much gas as the UK (our arithmetic) [1].
How natural gas production is measured
US agencies report gas in cubic feet, usually billion cubic feet per day (Bcf/d) or trillion cubic feet (Tcf) per year. Most international sources use cubic metres; one cubic metre is about 35.3 cubic feet. Figures also depend on what is counted. Gross production includes gas that is later flared or pumped back into fields; marketed production leaves that out, and also the volume lost when liquids such as ethane and propane are extracted in processing [3]. That is why the Energy Institute, OPEC and EIA give slightly different totals for the same country and year.
How much natural gas is left?
The EIA estimates the world had about 7,299 trillion cubic feet of proved natural gas reserves on 1 January 2021 [5]. Proved reserves are the amounts that geological and engineering data show can be recovered with reasonable certainty under current economic and operating conditions [5], so the figure changes as prices, technology and new discoveries change. At 2023’s output of roughly 143 trillion cubic feet a year, those reserves would last about 50 years (our arithmetic) if nothing new were found, which is not how reserves behave in practice: the estimate is revised as prices and technology change.
Questions about global natural gas production
Which country produces the most natural gas?
The United States, with about a quarter of world output: 100.17 billion cubic feet a day in 2023 and 26% of world production in 2025 [1][3].
How much natural gas does the world produce per day?
About 392.7 billion cubic feet a day in 2023 [1].
What are the top 5 natural gas producing countries?
The United States, Russia, Iran, China and Canada [1][3].
Which US state produces the most natural gas?
Texas, with 24.6% of US dry gas production in 2022, followed by Pennsylvania [4].
How much natural gas reserves are there in the world?
About 7,299 trillion cubic feet of proved reserves, as of 1 January 2021 [5].
Sources
- Econovis, Ehsan Soltani, Global Natural Gas Production (2023), the original map (data: Energy Institute).
- Energy Institute, Statistical Review of World Energy.
- Wikipedia, List of countries by natural gas production (OPEC Annual Statistical Bulletin 2026, data for 2025).
- US Energy Information Administration, Where our natural gas comes from.
- US Energy Information Administration, What is the volume of world natural gas reserves?.
Last reviewed 2 November 2026