Key figures from the chart
- NVIDIA was the largest semiconductor company by market cap on 30 December 2024, at $3.4 trillion.
- Broadcom ($1.1 trillion) and TSMC ($1.0 trillion) were the only other companies above $1 trillion.
- ASML ($275 billion) led the Netherlands and Samsung ($240 billion) led South Korea.
- US companies on the chart add up to about $6.1 trillion, 72% of everything shown, by our sum.
- All values are from the graphic, which cites Companiesmarketcap.com.
Largest semiconductor companies by market cap, in text
The chart is a circular Voronoi diagram titled “Global Semiconductor Companies by Market Cap”. Each cell’s area reflects market value and cells are grouped by country. The chart prints no ranks, so the order below is ours, by the printed values.
| Rank (our order) | Company | Country | Market cap, 30 Dec 2024 |
|---|---|---|---|
| 1 | NVIDIA | United States | $3.4T |
| 2 | Broadcom | United States | $1.1T |
| 3 | TSMC | Taiwan | $1.0T |
| 4 | ASML | Netherlands | $275B |
| 5 | Samsung | South Korea | $240B |
| 6 | AMD | United States | $199B |
| 7 | Qualcomm | United States | $172B |
| 8 | Texas Instruments | United States | $171B |
| 9 | Applied Materials | United States | $133B |
| 10 | Arm | United Kingdom | $132B |
| 11 | Analog Devices | United States | $105B |
| 12 | Marvell | United States | $97B |
| 13 | Micron | United States | $95B |
| 14 | Lam Research | United States | $93B |
| 15 | Intel | United States | $85B |
| 16 | KLA | United States | $85B |
| 17 | SK hynix | South Korea | $81B |
| 18 | Synopsys | United States | $75B |
| 19 | Tokyo Electron (TEL) | Japan | $71B |
| 20 | MediaTek | Taiwan | $69B |
| 21 | NXP | Netherlands | $53B |
| 22 | SMIC | China | $51B |
| 23 | Advantest | Japan | $43B |
| 24 | Infineon | Germany | $42B |
| 25 | Microchip | United States | $31B |
| 26 | Disco | Japan | $30B |
| 27 | ASM | Netherlands | $29B |
| 28 | MPS (Monolithic Power Systems) | United States | $29B |
| 29 | onsemi | United States | $27B |
| 30 | GlobalFoundries | United States | $24B |
The chart also has cells for smaller companies grouped as “Other” in several countries, and one unlabelled cell for the rest of the world.
| Group | Value |
|---|---|
| Other, United States | $172B |
| Other, Taiwan | $111B |
| Other, Japan | $43B |
| Other, China | $25B |
| Other, Germany | $5B |
| Other, Rest of World (unlabelled cell) | $73B |
Footer: “Figures as of Dec 30, 2024. Source: Companiesmarketcap.com”, with the Visual Capitalist and Voronoi logos.
Market cap by country
The chart does not print country totals. These are our sums of every value shown, including the “Other” cells.
| Country | Sum of values on the chart | Share of the chart total |
|---|---|---|
| United States | $6.09T | 72% |
| Taiwan | $1.18T | 14% |
| Netherlands | $0.36T | 4% |
| South Korea | $0.32T | 4% |
| Japan | $0.19T | 2% |
| United Kingdom | $0.13T | 2% |
| China | $0.08T | 1% |
| Rest of World | $0.07T | 1% |
| Germany | $0.05T | 1% |
| Total | $8.47T |
What the chart measures
Market capitalisation is the total value of a company’s shares: the share price multiplied by the number of shares outstanding [3]. It reflects what investors will pay for a company on a given day, not its sales or chip output, and it changes with every trading day. A chart dated 30 December 2024 is therefore a snapshot.
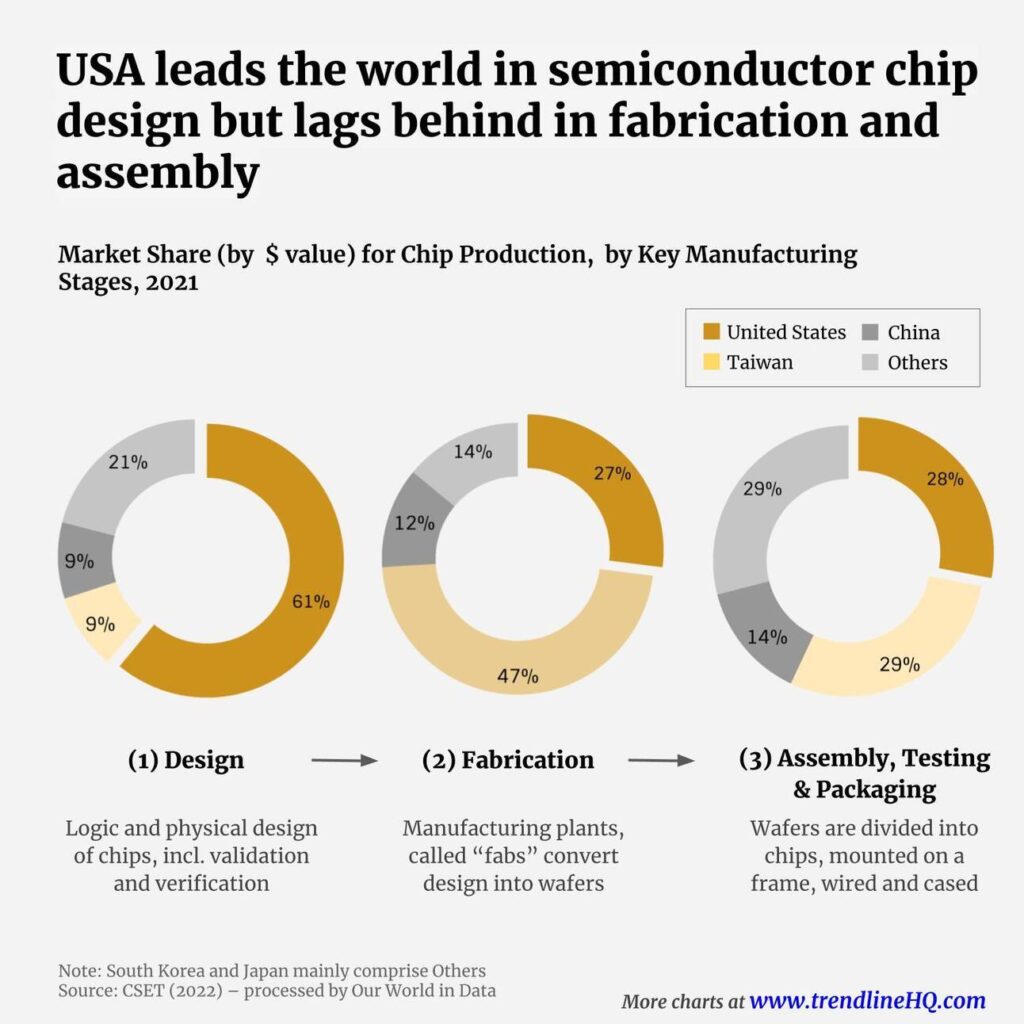
The companies on the chart do different jobs in the industry. Wikipedia explains that before the 1980s chip companies designed and made chips in their own plants, but today much of the industry follows the foundry model, in which separate companies design chips and manufacture them. Some firms, called integrated device manufacturers, still do both. TSMC emerged in the mid 1980s as a foundry making other companies’ designs, and as of 2021 only three firms, TSMC, Samsung and Intel, could make the most advanced chips [2].
On the chart, TSMC, SMIC and GlobalFoundries are foundries, Samsung and Intel both design and make chips, and companies such as ASML, Applied Materials, Lam Research, KLA, Tokyo Electron, ASM and Advantest make the equipment used to produce and test them.
Notes on this infographic
- Date. All values are for 30 December 2024. Current market caps will differ. CompaniesMarketCap updates its ranking daily [1].
- Rounding. Values are rounded to $0.1 trillion or $1 billion, so several companies share the same figure (Intel and KLA at $85 billion, ASM and MPS at $29 billion).
- Listed companies only. CompaniesMarketCap excludes semiconductor companies that are not publicly traded [1].
- Our arithmetic. The ranks, country totals and shares on this page are our own sums of the printed values.
Questions about the largest semiconductor companies
What are the top 10 semiconductor companies by market cap?
On 30 December 2024, by this chart: NVIDIA, Broadcom, TSMC, ASML, Samsung, AMD, Qualcomm, Texas Instruments, Applied Materials and Arm.
Is TSMC bigger than Intel?
By market cap, yes. On the chart TSMC is worth $1.0 trillion and Intel $85 billion, so TSMC was valued at more than 11 times Intel on 30 December 2024.
What is TSMC’s market cap?
$1.0 trillion on 30 December 2024, according to the chart. Market caps change daily, so for a current figure see CompaniesMarketCap [1].
Sources
- CompaniesMarketCap, Largest semiconductor companies by market cap.
- Wikipedia, Semiconductor industry.
- Wikipedia, Market capitalization.
Last reviewed 29 October 2026