What is the median home price in each state?
On Realtor.com’s latest monthly figures, for September 2026, the median listing price of a home in the US was $419,250 [2]. Hawaii was the most expensive state at $732,450, followed by California ($725,000) and Massachusetts ($714,250). West Virginia was the cheapest at $259,997, with Louisiana ($270,000) and Ohio ($284,000) next [3].
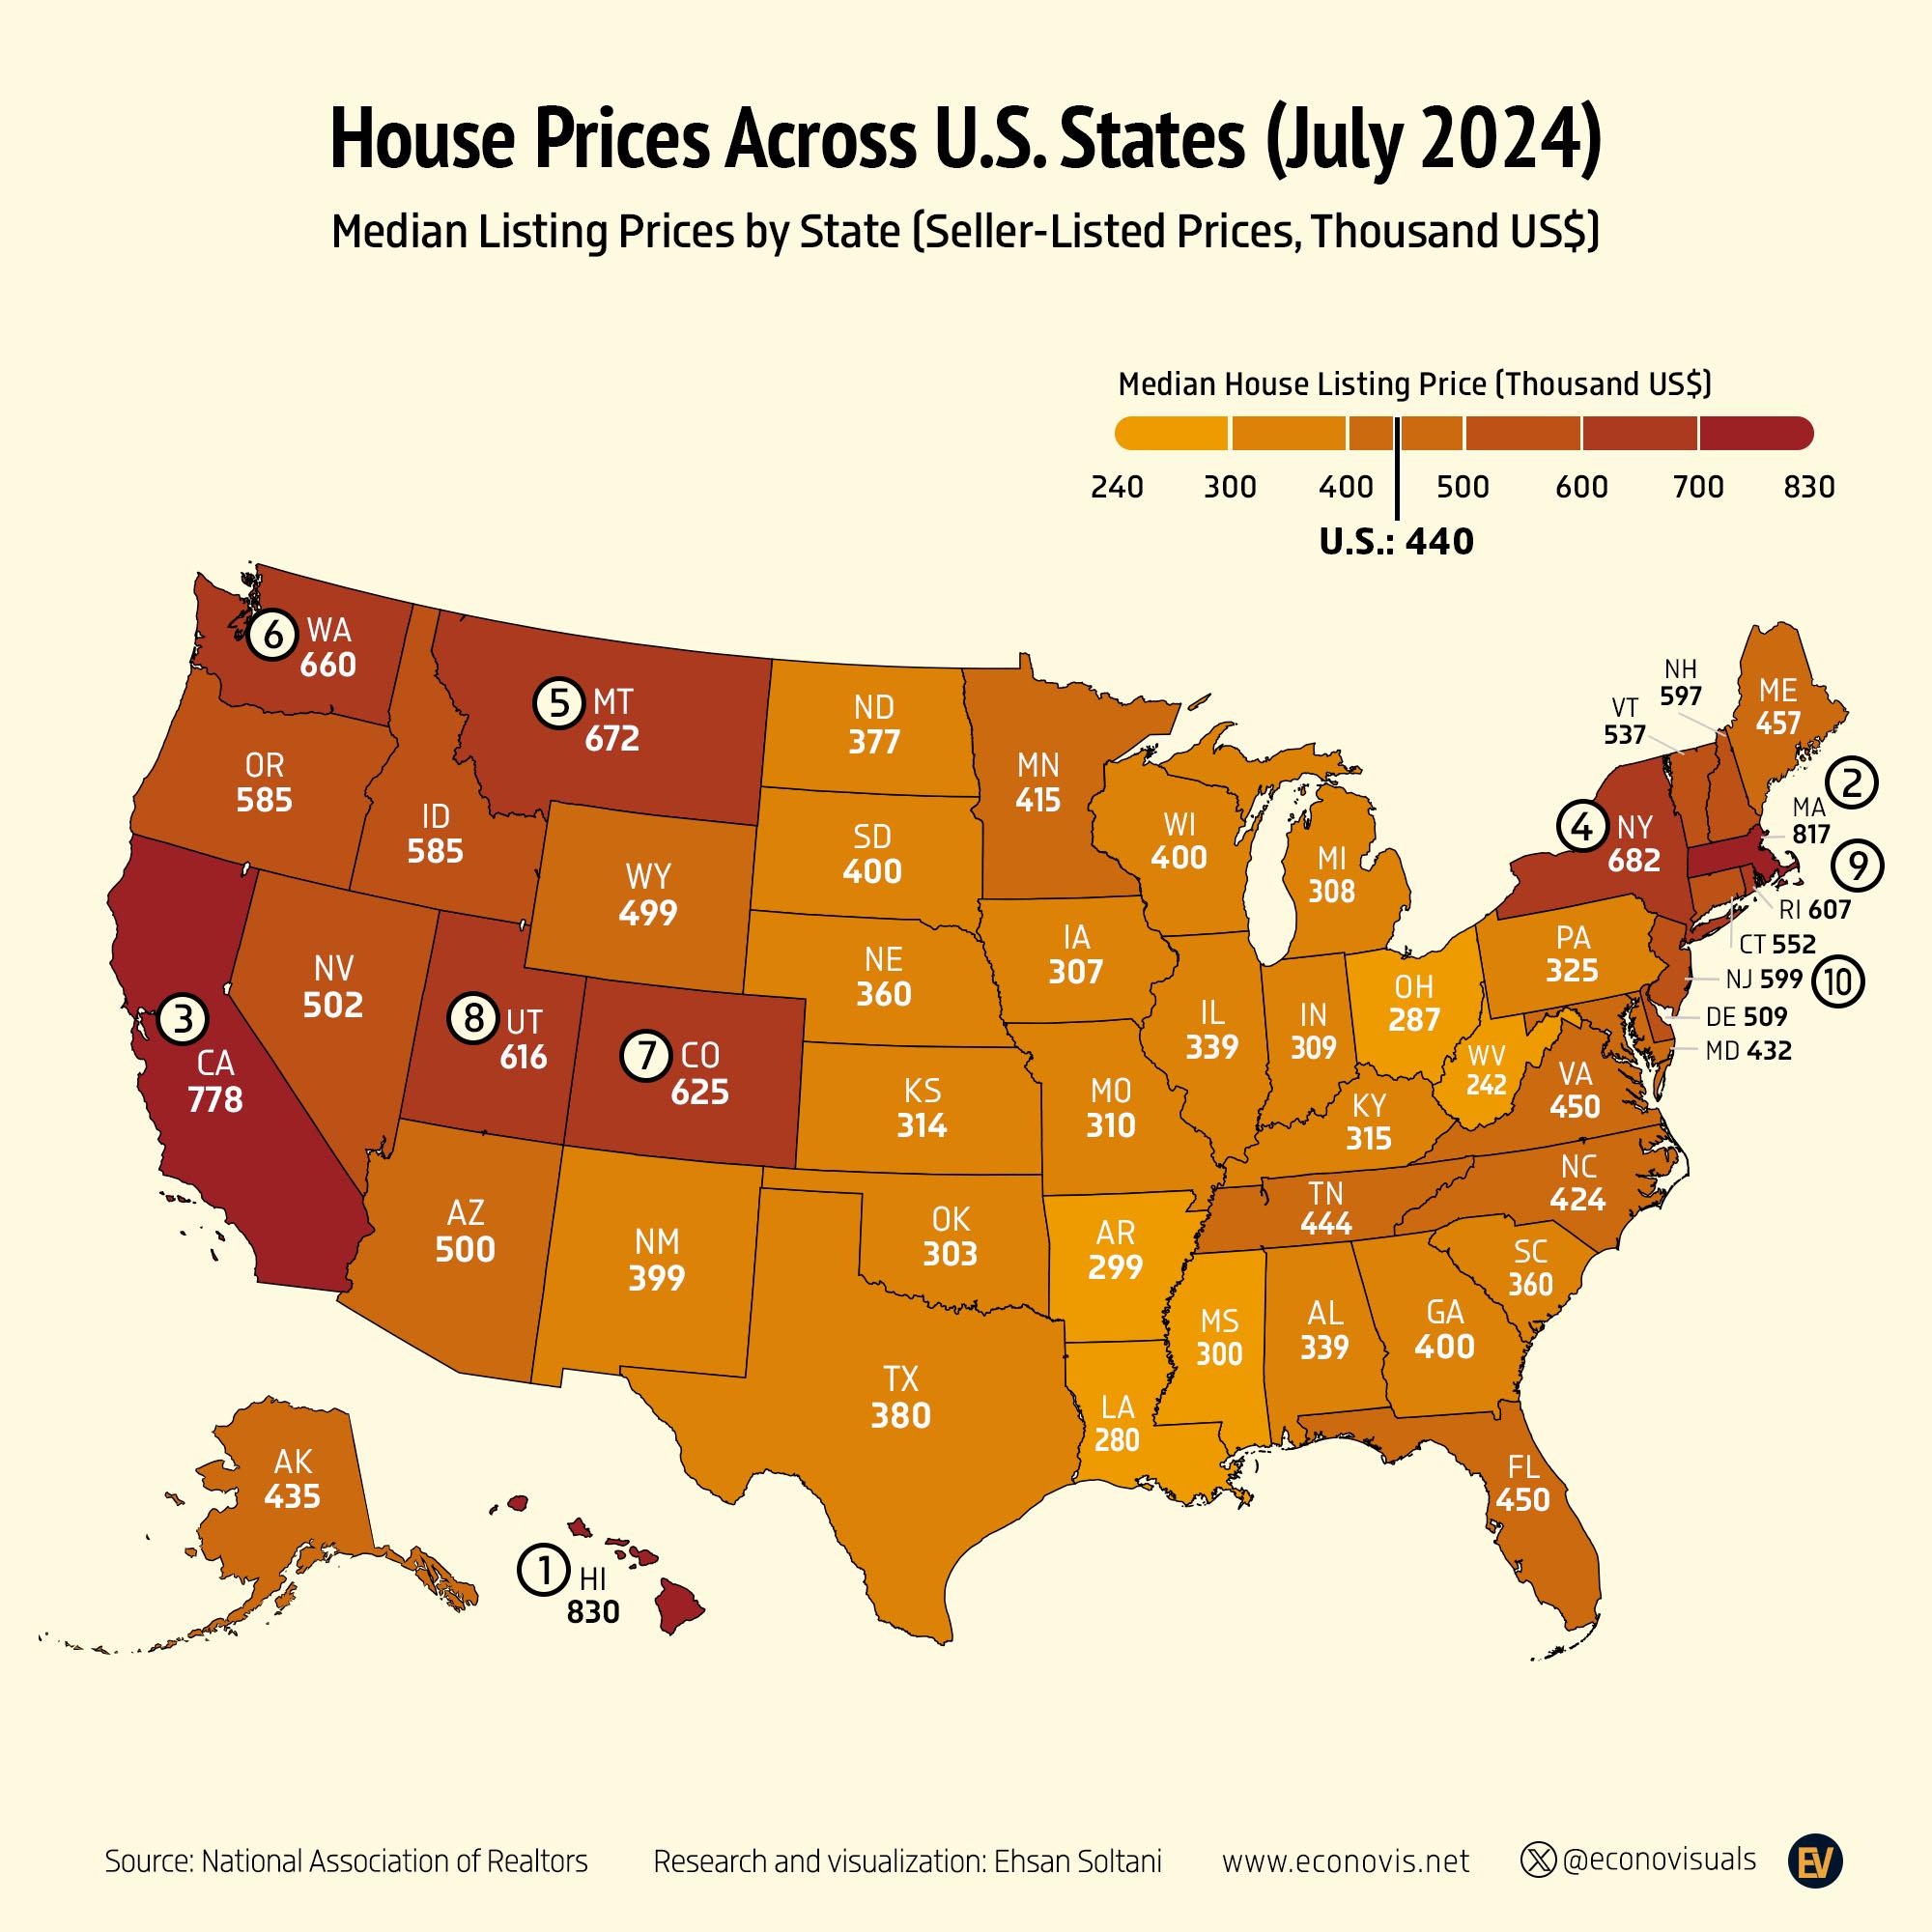
The table below gives every state’s median listing price for September 2026, next to the July 2024 figure shown on the Econovis map by Ehsan Soltani at the top of this page [1][3]. The map uses Realtor.com’s data; it credits the National Association of Realtors, but the state figures are Realtor.com’s listing data for July 2024 [1][3]. Realtor.com has revised its history slightly since the map was made, so its current files give a few figures a little differently (Hawaii at $826,125 rather than $830,000, for example) [3].
| State | Median listing price, September 2026 | Median listing price, July 2024 (as on the map) |
|---|---|---|
| Hawaii | $732,450 | $830,000 |
| California | $725,000 | $777,900 |
| Massachusetts | $714,250 | $817,475 |
| Washington | $639,475 | $659,925 |
| Montana | $635,000 | $672,400 |
| New York | $605,000 | $682,000 |
| Idaho | $593,000 | $585,000 |
| New Hampshire | $590,000 | $596,500 |
| Utah | $579,000 | $615,900 |
| Rhode Island | $569,900 | $607,450 |
| Colorado | $564,000 | $624,950 |
| New Jersey | $559,500 | $599,000 |
| Oregon | $550,000 | $584,999 |
| District of Columbia | $527,500 | not shown |
| Connecticut | $522,500 | $552,225 |
| Vermont | $499,450 | $537,000 |
| Wyoming | $496,500 | $499,275 |
| Delaware | $484,998 | $509,247 |
| Nevada | $480,000 | $502,222 |
| Arizona | $459,900 | $499,998 |
| Virginia | $455,953 | $449,900 |
| Maine | $450,000 | $457,000 |
| Alaska | $435,000 | $435,000 |
| Tennessee | $429,450 | $443,950 |
| Maryland | $425,000 | $432,000 |
| Florida | $409,950 | $449,900 |
| North Carolina | $400,000 | $424,319 |
| New Mexico | $399,475 | $399,250 |
| Wisconsin | $389,900 | $399,900 |
| Georgia | $389,750 | $399,925 |
| Minnesota | $379,900 | $414,900 |
| South Dakota | $375,000 | $399,600 |
| North Dakota | $370,700 | $377,000 |
| South Carolina | $359,945 | $360,000 |
| Texas | $355,765 | $380,000 |
| Nebraska | $335,000 | $359,900 |
| Alabama | $325,000 | $339,200 |
| Illinois | $324,950 | $339,450 |
| Arkansas | $318,743 | $299,250 |
| Pennsylvania | $309,000 | $325,000 |
| Kentucky | $307,775 | $315,000 |
| Missouri | $300,000 | $310,000 |
| Michigan | $299,900 | $308,450 |
| Indiana | $299,000 | $309,450 |
| Oklahoma | $296,643 | $302,500 |
| Kansas | $296,000 | $313,500 |
| Mississippi | $292,250 | $299,900 |
| Iowa | $284,900 | $307,000 |
| Ohio | $284,000 | $286,500 |
| Louisiana | $270,000 | $279,997 |
| West Virginia | $259,997 | $242,450 |
| United States | $419,250 | about $440,000 |
Washington, D.C. is not shown on the map. Realtor.com puts its median listing price at $527,500 for September 2026 [3].
Which states have the most expensive homes?
The most expensive housing markets are in the Pacific, the Mountain West and the Northeast. In September 2026, 14 states had a median listing price of $500,000 or more: Hawaii, California, Massachusetts, Washington, Montana, New York, Idaho, New Hampshire, Utah, Rhode Island, Colorado, New Jersey, Oregon and Connecticut [3]. The map shows the same pattern in July 2024, when the ten priciest states ran from Hawaii at $830,000 down to New Jersey at $599,000 [1].
Hawaii is also the most expensive state per square foot by a wide margin, at $717 a square foot in September 2026 against $456 in California [3]. Montana stands out as an inland state among the coastal ones: it was fifth in July 2024 at $672,400, and still fifth in September 2026 at $635,000 [1][3].
Which states have the cheapest homes?
The cheapest homes are mostly in the South and the Midwest. West Virginia has been the cheapest state on both dates, at $242,450 in July 2024 and $259,997 in September 2026 [1][3]. Nine states had a median listing price under $300,000 in September 2026: West Virginia, Louisiana, Ohio, Iowa, Mississippi, Kansas, Oklahoma, Indiana and Michigan [3].
The gap between the top and bottom is large but has narrowed a little. In July 2024 Hawaii’s median listing price was about 3.4 times West Virginia’s; in September 2026 it was about 2.8 times (our arithmetic) [1][3]. Homes in West Virginia also cost the least per square foot, at $147 [3].
How home prices have changed since 2024
Asking prices have been broadly flat to slightly lower since the map was made. Comparing the same month to avoid seasonal effects, the US median listing price was $428,950 in July 2026 against $437,450 in July 2024, a fall of about 2% [2]. Over the same two years the number of homes actively listed for sale rose by about 27%, from 884,080 to 1,126,252 [2].
Of the 50 states and D.C., 32 had a lower median listing price in July 2026 than in July 2024. The biggest falls were in Hawaii (about 10%), D.C. (about 9%), Colorado, Florida and Arizona, while West Virginia, Arkansas and Ohio rose the most, by about 5% to 8% (our arithmetic from Realtor.com’s data) [3]. Listing prices also move with the seasons, peaking in June in each of the last three years, which is part of why September figures are lower than July ones [2].
Listing price or sale price?
A median listing price is the middle asking price of the homes listed for sale in an area during a month [4]. It is not what buyers end up paying, and it shifts with the mix of homes on the market: a month with more large new homes listed will show a higher median even if the price of a typical house has not moved.
Sale prices come from other sources. The Census Bureau’s median sales price of new houses sold in the US was $393,300 in the third quarter of 2026 [5]. Realtor.com’s own September 2026 figures show the typical listed home had 1,825 square feet, at a median of $223 a square foot, and about one in five listings had a price cut during the month [2]. If you are comparing states for a move, price per square foot and local taxes and insurance are worth checking alongside the headline median.
Questions about the median home price by state
What is the median home price in the US right now?
The US median listing price was $419,250 in September 2026, on Realtor.com’s figures [2]. In July 2024, when the map was made, it was about $440,000 [1].
What state has the cheapest houses?
West Virginia, with a median listing price of $259,997 in September 2026, followed by Louisiana ($270,000) and Ohio ($284,000) [3].
Which state has the most expensive homes?
Hawaii, at $732,450 in September 2026, just ahead of California ($725,000) and Massachusetts ($714,250) [3]. The order of the top three changes from month to month; in July 2026 Massachusetts was briefly first at $749,450 [3].
What is the median home price in Texas?
$355,765 in September 2026, below the national median, down from $380,000 in July 2024 [1][3].
What is the median home price in Florida?
$409,950 in September 2026, down from $449,900 in July 2024 [1][3].
Sources
- Ehsan Soltani (Econovis), House Prices Across U.S. States (July 2024), Voronoi, 14 August 2024 (the original map and its dataset).
- Realtor.com, Residential real estate data library, national inventory history (monthly, to September 2026), read 4 November 2026.
- Realtor.com, Residential real estate data library, state inventory history (monthly, to September 2026), read 4 November 2026.
- Realtor.com, Data definitions, median listing price.
- US Census Bureau via FRED, Median Sales Price of New Houses Sold for the United States (MSPUS), updated 27 October 2026.
Last reviewed 4 November 2026