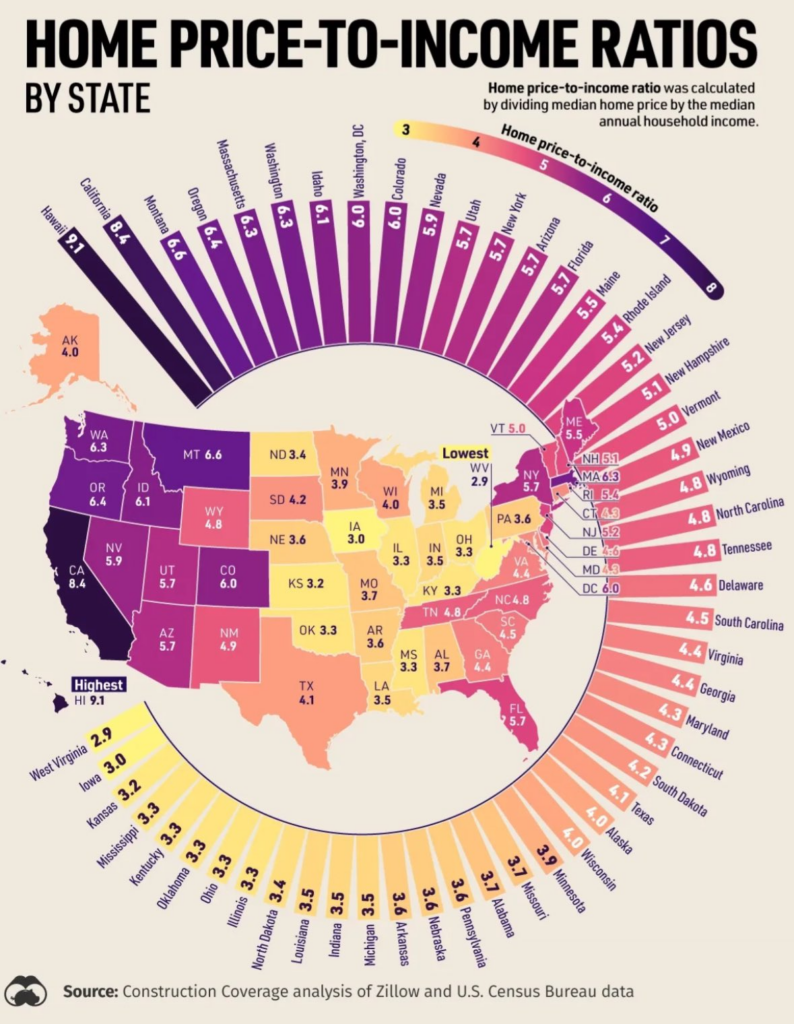
Housing affordability by state ranges from West Virginia, where a typical home costs about three years of average income, to Hawaii, where it costs nearly eleven. Across the US a typical home cost about 4.8 years of per person income in 2025, and the cheapest states to buy in are in Appalachia, the Midwest, the Plains and the lower Mississippi Valley.
The map by Ehsan Soltani of Econovis measures affordability in a simple way, by dividing a year of personal income per person by the typical home value in each state, for the first quarter of 2024. A higher percentage means a year of income buys a bigger share of a home. We have checked its figures against the same sources and updated the ranking below with the latest full year of data.
Most and least affordable states for housing
West Virginia is the most affordable state for housing and Hawaii the least, and that was true in early 2024 and is still true on the latest figures. In West Virginia average personal income per person was $57,932 in 2025, according to the US Bureau of Economic Analysis (BEA), and the typical home was worth about $172,000 in December 2025, according to the Zillow Home Value Index. In Hawaii income was $76,592 per person, but the typical home was worth about $827,000.
The rest of the top five are Oklahoma, Louisiana, Iowa and Kansas, with Mississippi level with Kansas. At the other end, California, Utah, Idaho, Oregon and Rhode Island follow Hawaii. Econovis had the same states at the top and bottom in early 2024, with West Virginia at 34%, Iowa, Oklahoma and Louisiana at 30%, California at 11% and Hawaii at 8%.
Housing affordability by state, full ranking
The table ranks all 50 states by how much of a typical home one year of average income would buy. It uses the Econovis method with BEA per capita personal income for 2025 and the Zillow Home Value Index for December 2025 (mid tier homes, seasonally adjusted). The percentage and years columns are our own arithmetic from those two figures, and home values are rounded to the nearest $1,000.
| Rank | State | Income per person, 2025 | Typical home value, Dec 2025 | Income as % of home value | Years of income per home |
|---|---|---|---|---|---|
| 1 | West Virginia | $57,932 | $172,000 | 34% | 3.0 |
| 2 | Oklahoma | $66,660 | $217,000 | 31% | 3.3 |
| 3 | Louisiana | $63,940 | $210,000 | 30% | 3.3 |
| 4 | Iowa | $68,326 | $232,000 | 29% | 3.4 |
| 5 | Kansas | $69,510 | $241,000 | 29% | 3.5 |
| 6 | Mississippi | $54,531 | $191,000 | 29% | 3.5 |
| 7 | Arkansas | $61,752 | $219,000 | 28% | 3.6 |
| 8 | Ohio | $67,291 | $241,000 | 28% | 3.6 |
| 9 | Nebraska | $75,858 | $274,000 | 28% | 3.6 |
| 10 | Illinois | $77,772 | $286,000 | 27% | 3.7 |
| 11 | North Dakota | $75,157 | $283,000 | 27% | 3.8 |
| 12 | Indiana | $66,292 | $252,000 | 26% | 3.8 |
| 13 | Kentucky | $60,673 | $231,000 | 26% | 3.8 |
| 14 | Pennsylvania | $74,231 | $282,000 | 26% | 3.8 |
| 15 | Missouri | $67,587 | $259,000 | 26% | 3.8 |
| 16 | Michigan | $66,556 | $258,000 | 26% | 3.9 |
| 17 | Alabama | $59,677 | $235,000 | 25% | 3.9 |
| 18 | South Dakota | $79,297 | $314,000 | 25% | 4.0 |
| 19 | Wyoming | $89,806 | $362,000 | 25% | 4.0 |
| 20 | Texas | $72,364 | $300,000 | 24% | 4.1 |
| 21 | Connecticut | $98,879 | $431,000 | 23% | 4.4 |
| 22 | Minnesota | $78,538 | $345,000 | 23% | 4.4 |
| 23 | Wisconsin | $70,570 | $327,000 | 22% | 4.6 |
| 24 | Tennessee | $69,131 | $330,000 | 21% | 4.8 |
| 25 | Alaska | $80,175 | $384,000 | 21% | 4.8 |
| 26 | South Carolina | $63,179 | $303,000 | 21% | 4.8 |
| 27 | North Carolina | $68,511 | $334,000 | 21% | 4.9 |
| 28 | Florida | $76,440 | $377,000 | 20% | 4.9 |
| 29 | Georgia | $65,382 | $331,000 | 20% | 5.1 |
| 30 | New Mexico | $61,645 | $312,000 | 20% | 5.1 |
| 31 | Virginia | $80,291 | $407,000 | 20% | 5.1 |
| 32 | Maryland | $81,834 | $426,000 | 19% | 5.2 |
| 33 | Vermont | $74,580 | $390,000 | 19% | 5.2 |
| 34 | Delaware | $71,357 | $402,000 | 18% | 5.6 |
| 35 | New York | $88,847 | $504,000 | 18% | 5.7 |
| 36 | Maine | $71,662 | $408,000 | 18% | 5.7 |
| 37 | New Hampshire | $86,959 | $503,000 | 17% | 5.8 |
| 38 | Nevada | $73,156 | $447,000 | 16% | 6.1 |
| 39 | Arizona | $68,283 | $421,000 | 16% | 6.2 |
| 40 | Colorado | $86,181 | $538,000 | 16% | 6.2 |
| 41 | New Jersey | $88,223 | $560,000 | 16% | 6.3 |
| 42 | Montana | $72,340 | $462,000 | 16% | 6.4 |
| 43 | Massachusetts | $97,456 | $648,000 | 15% | 6.6 |
| 44 | Washington | $89,396 | $596,000 | 15% | 6.7 |
| 45 | Rhode Island | $73,992 | $496,000 | 15% | 6.7 |
| 46 | Oregon | $73,678 | $495,000 | 15% | 6.7 |
| 47 | Idaho | $64,846 | $472,000 | 14% | 7.3 |
| 48 | Utah | $69,991 | $534,000 | 13% | 7.6 |
| 49 | California | $91,116 | $761,000 | 12% | 8.4 |
| 50 | Hawaii | $76,592 | $827,000 | 9% | 10.8 |
| United States | $76,393 | $364,000 | 21% | 4.8 |
Washington, D.C. is left out of the ranking because it is a city rather than a state. On the same sums it sits at about 20%, with income of $116,121 per person and a typical home value of about $574,000.
How housing affordability has changed since 2024
Nationally, affordability on this measure improved slightly between early 2024 and the end of 2025, because incomes grew faster than home values. BEA puts US income per person up 4.3% in 2025, while the national Zillow index rose about 2% between March 2024 and December 2025, from about $357,000 to $364,000. That moved the US figure from about 20% in the Econovis map to about 21%.
The change was not the same everywhere. Home values fell in Florida (from about $403,000 to $377,000), Texas, Arizona, Colorado and Washington, D.C. over that period, so those places became a little more affordable. Some of the biggest rises were in the Northeast and around the Great Lakes. Home values in New York, New Jersey, Rhode Island, Connecticut, Wisconsin, Illinois and North Dakota all rose by more than 8%, faster than incomes there, so housing in those states became a little less affordable.
Why housing is cheaper in some states
The gap between states comes mostly from house prices, not incomes. Income per person varies by less than two to one across the states, from $54,531 in Mississippi to $98,879 in Connecticut, according to BEA. Typical home values vary by almost five to one, from about $172,000 in West Virginia to about $827,000 in Hawaii.
Prices are highest where land is scarce or expensive and demand is strong, such as Hawaii, coastal California and the Boston to New York corridor, and in the fast growing Mountain West states of Utah, Idaho and Montana, where typical home values are now well above what local incomes would suggest. The cheapest states tend to have plenty of land, slower population growth and lower building costs. This shows up in wider living costs too. BEA’s regional price parities for 2024 put California (110.7) and Hawaii (110.0) highest and Arkansas (86.9), Mississippi (87.0), Iowa and Oklahoma (both 87.8) lowest, against a national level of 100. BEA notes that rents are often the main reason for the differences, with rents in California at 154.3 and in West Virginia at 54.2.
What this measure leaves out
Income as a share of home value is a quick way to compare states, but it is not what a buyer actually pays. It leaves out mortgage rates, deposits, property tax and home insurance, and all of these vary a lot.
- Mortgage rates. The same price to income ratio costs far more each month when rates are high. Freddie Mac’s Primary Mortgage Market Survey put the average 30 year fixed rate at 7.11% on 12 November 2026.
- Property tax and insurance. Rates vary a lot between states and even between counties, so the monthly cost in a state with cheap homes can still be higher than the price suggests. Texas, for example, has no state income tax but some of the highest property tax rates in the country.
- Income per person, not per household. BEA personal income includes wages, business income, dividends, interest, rent and government benefits, divided by everyone in the state, including children. Household incomes are higher, so the Harvard Joint Center for Housing Studies, which uses household income, puts the national ratio at about five times income for 2024 (more on that below).
- State averages hide cities. A state can look affordable while its main city is not. Within any state, homes in the largest metro areas usually cost far more than in rural areas.
Home prices compared with household income
Measured against household income, the typical US home now costs about five years of income, well above the long run norm. The Harvard Joint Center for Housing Studies reports in The State of the Nation’s Housing 2025 that the median existing single family home price reached a record $412,500 in 2024, according to the National Association of Realtors, which is five times the median household income. The Joint Center notes that this is far above the ratio of about 3 that was typical before the early 2000s housing boom.
Questions about housing affordability by state
What is the best state for affordable housing?
West Virginia. A typical home there was worth about $172,000 in December 2025, about three years of average income per person, according to Zillow and BEA figures. Oklahoma, Louisiana, Iowa and Kansas come next.
What state has the highest housing prices?
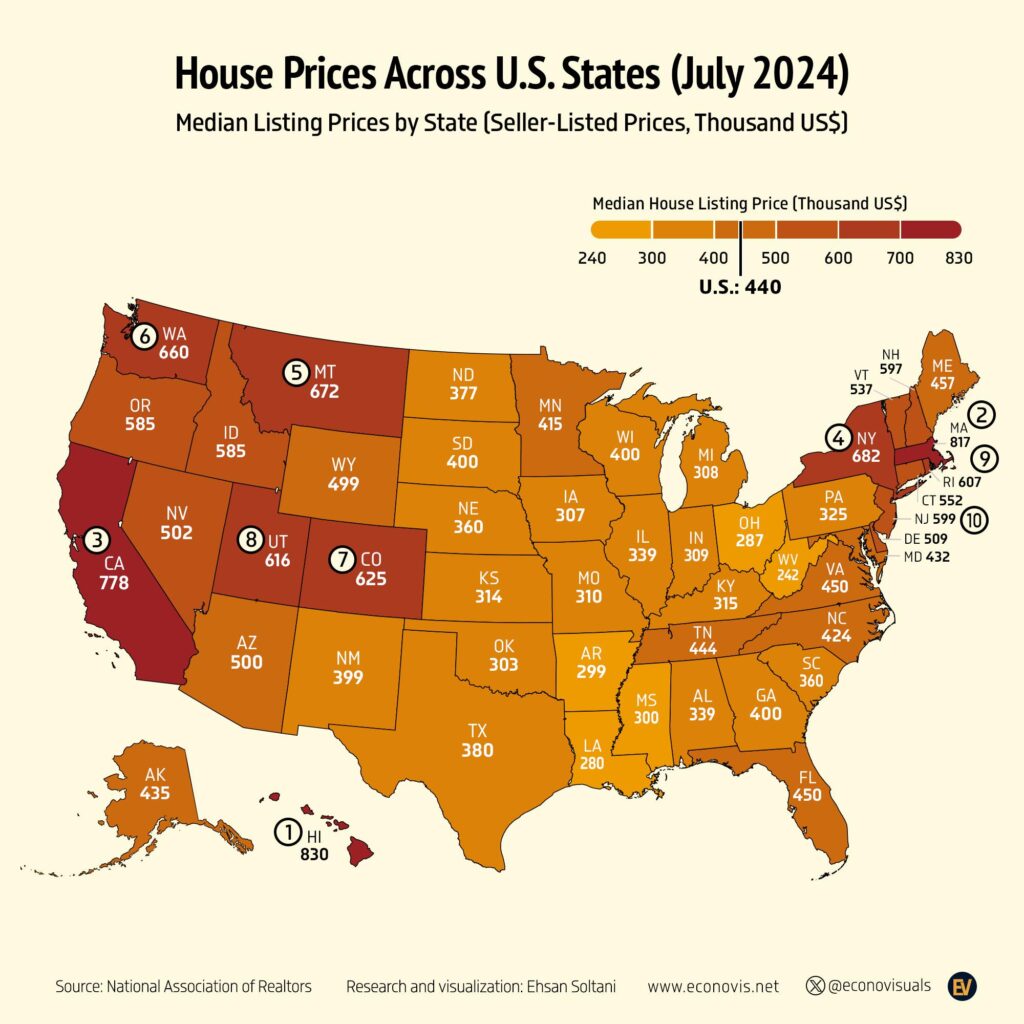
Hawaii, with a typical home value of about $827,000 in December 2025, followed by California at about $761,000 and Massachusetts at about $648,000, according to the Zillow Home Value Index. Washington, D.C., at about $574,000, would rank fourth if it were a state.
What salary do you need for a $400,000 house?
Roughly $90,000 to $105,000 a year, using the common guide that the mortgage payment should be no more than 28% of gross income. At the 7.11% average 30 year rate from Freddie Mac in November 2026, a $400,000 home with a 20% deposit has a monthly principal and interest payment of about $2,150, which needs an income of about $92,000. With a 10% deposit the payment is about $2,420 and the income needed is about $104,000. Property tax and insurance come on top, so in practice the figure is higher, and lenders also look at your other debts.
What state has the lowest overall cost of living?
Arkansas, according to BEA’s regional price parities for 2024, where prices overall were 86.9% of the national level. Mississippi (87.0), Iowa and Oklahoma (both 87.8) are close behind.
Is housing affordable in the US?
Less than it used to be. A typical home cost about 4.8 years of income per person in 2025 on the Econovis measure, and five times median household income in 2024 according to Harvard’s Joint Center, compared with about three times before the 2000s. With mortgage rates around 7%, monthly payments are also much higher than they were in 2021.
Sources
- Ehsan Soltani, Econovis, Housing Affordability Across U.S. States (Q1 2024).
- US Bureau of Economic Analysis, Personal Income by State, per capita personal income for 2024 and 2025 (SAINC1).
- Zillow Research, Zillow Home Value Index (ZHVI), state and national series, accessed November 2026.
- US Bureau of Economic Analysis, Regional Price Parities by State and Metro Area, 2024.
- Harvard Joint Center for Housing Studies, The State of the Nation’s Housing 2025.
- Freddie Mac, Primary Mortgage Market Survey, 12 November 2026.