Key points from the infographic
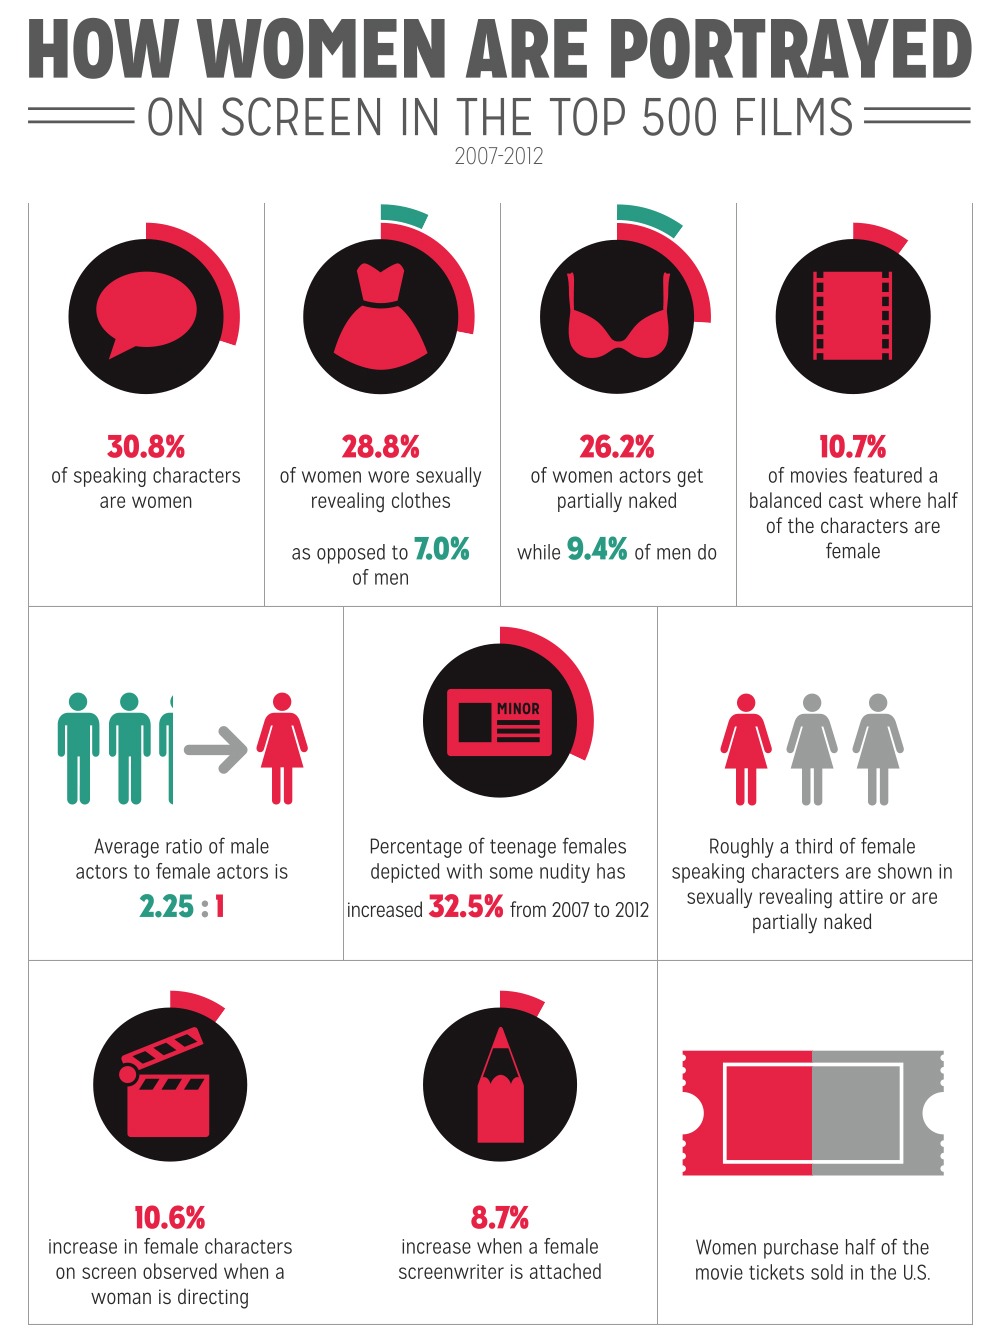
- Women made up 30.8% of speaking characters in the top 500 films from 2007 to 2012, and the average ratio of male to female actors was 2.25 to 1.
- Only 10.7% of the films had a balanced cast, meaning half of the characters were female.
- 28.8% of women wore sexually revealing clothes, compared with 7.0% of men, and 26.2% of women were shown partially naked, compared with 9.4% of men.
- The share of teenage girls shown with some nudity rose by 32.5% from 2007 to 2012.
- Films with a woman directing showed 10.6% more female characters on screen, and films with a female screenwriter 8.7% more.
How women are portrayed on screen, in text
The graphic is titled “How Women Are Portrayed On Screen in the Top 500 Films, 2007 to 2012”. It uses red for women and green for men, with each figure set beside an icon and a partly filled ring. This is everything it says, in order.
| Figure | What the infographic says |
|---|---|
| 30.8% | of speaking characters are women |
| 28.8% | of women wore sexually revealing clothes, as opposed to 7.0% of men |
| 26.2% | of women actors get partially naked, while 9.4% of men do |
| 10.7% | of movies featured a balanced cast where half of the characters are female |
| 2.25 : 1 | average ratio of male actors to female actors |
| 32.5% | increase from 2007 to 2012 in the percentage of teenage females depicted with some nudity |
| About a third | of female speaking characters are shown in sexually revealing attire or are partially naked |
| 10.6% | increase in female characters on screen when a woman is directing |
| 8.7% | increase when a female screenwriter is attached |
| Half | of the movie tickets sold in the U.S. are purchased by women |
Where the graphic comes from
This is the opening section of the New York Film Academy’s “Gender Inequality in Film” infographic, published on 25 November 2013. NYFA said it reviewed the data after the opening of The Hunger Games: Catching Fire and concluded that “Hollywood remains stuck in its gender bias” [1]. The full infographic goes on to cover women working behind the camera, pay, awards and emerging filmmakers. In March 2018 NYFA released an updated version covering 2007 to 2017, drawing on more than 40 sources and studies [2].
What later research found
The USC Annenberg Inclusion Initiative, led by Professor Stacy L. Smith, studies the top grossing films each year. Its 2018 report examined 48,757 characters in 1,100 popular films from 2007 to 2017 and found that female speaking characters filled 30.6% of roles across those 11 years, close to the 30.8% on this graphic. It also found female characters were more than twice as likely as male characters to be shown in sexually revealing clothing, partially naked, or referred to as attractive, and that 4.3% of 1,223 directors were women [3].
On lead roles, the Initiative’s 2022 brief found that 41% of the 100 top grossing films of 2021 had a female lead or co lead, compared with 20% in 2007. It reported that films were far less likely to have women aged 45 or older in lead roles than men of the same age [4].
Notes on this infographic
- Crop of a larger graphic. Our copy is one section of NYFA’s infographic and carries no logo or source line. The source list at the foot of NYFA’s full version is too small to read in the copy we opened, so we could not check each figure against its original study [1].
- Relative increases. The 32.5%, 10.6% and 8.7% figures are described as increases. The graphic does not say whether they are percentage point or relative changes.
- Ticket sales. The claim that women buy half of U.S. cinema tickets is not sourced on the graphic, and we did not find a source to confirm it.
- Period covered. All figures describe films from 2007 to 2012. Later figures from USC Annenberg are given above.
Questions about women in film
How are women portrayed in films?
In the top 500 films from 2007 to 2012, this infographic reports that women were 30.8% of speaking characters and were about four times as likely as men to wear sexually revealing clothes (28.8% against 7.0%) [1]. USC Annenberg’s study of films from 2007 to 2017 found female characters were more than twice as likely as male characters to be sexualised on screen [3].
How are women portrayed in the media?
The sources used here cover film only. For popular films, USC Annenberg found that women filled 30.6% of speaking roles from 2007 to 2017 and that 41% of the top films of 2021 had a female lead or co lead [3][4].
What percentage of film directors are women?
Women were 4.3% of 1,223 directors of popular films from 2007 to 2017, according to USC Annenberg's 2018 report [3]. The New York Film Academy infographic reports that films with a woman directing showed 10.6% more female characters on screen, and films with a female screenwriter 8.7% more. The graphic does not say whether these are percentage point or relative increases.
What is the ratio of male to female actors in films?
The average ratio of male to female actors in the top 500 films from 2007 to 2012 was 2.25 to 1. Only 10.7% of those films had a balanced cast, meaning half of the characters were female. Women made up 30.8% of speaking characters, close to the 30.6% that USC Annenberg later found across popular films from 2007 to 2017 [3].
Sources
- New York Film Academy, Gender Inequality in Film, 25 November 2013.
- New York Film Academy, Gender Inequality in Film Infographic Updated in 2018, 8 March 2018.
- USC Annenberg, Happy to fire, reluctant to hire, Hollywood inclusion remains unchanged, 30 July 2018.
- USC Annenberg, Despite industry upheaval, the story is the same for women, people of color in leading roles, 11 March 2022.
Last reviewed 29 October 2026