Median household income by race and ethnicity in 2025
The official yearly figures come from the Census Bureau’s Current Population Survey, published each September for the previous year. In 2025 the median household income for the whole of the United States was $87,460, the highest on record since the series began in 1967 [1]. Broken down by the race or Hispanic origin of the householder, it looked like this [2]:
| Householder | Median household income, 2025 | Change from 2024 (after inflation) |
|---|---|---|
| Asian | $126,300 | No significant change |
| White, not Hispanic | $96,710 | Up 2.9% |
| White (including Hispanic White) | $91,930 | Up 3.0% |
| All households | $87,460 | Up 2.6% |
| Hispanic (any race) | $73,260 | No significant change |
| Black | $59,980 | Up 4.8% |
So the typical Black household had about 62% of the income of the typical non-Hispanic White household in 2025, and the typical Hispanic household about 76%. Asian households had a median around 44% above the national figure (our arithmetic from the Census table [2]).
The yearly Census report only shows these broad groups. For smaller groups, such as American Indian and Alaska Native or Native Hawaiian and Pacific Islander households, and for national origin groups, you need the much larger American Community Survey, which is what the figures below are based on.
Median household income by national origin group
The broad “Asian” figure hides very large differences between national origin groups. The India in Pixels chart on this page breaks Asian Americans down by country of origin using the 2013 to 2015 American Community Survey, and puts Indian American households first at $100,500, against $56,200 for all US households, almost 1.8 times as much. Filipino ($83,300) and Taiwanese ($82,500) households came next, while Nepali ($43,500) and Bangladeshi ($50,000) households were below the national median. Those figures are in line with Pew Research Center’s analysis of the same survey for 2015, which put Indian households at $100,000 and Burmese households, the lowest Asian group, at $36,000 [3].
Incomes have risen a lot since then. Pew’s fact sheets based on the 2023 American Community Survey give these medians, in 2023 dollars [4]:
| Household head | Median household income, 2023 | Aged 25 and older with a bachelor’s degree or higher |
|---|---|---|
| Indian | $151,200 | 77% |
| Taiwanese | $133,300 | 83% |
| Pakistani | $108,100 | 59% |
| Filipino | $106,400 | 50% |
| Sri Lankan | $103,000 | 61% |
| Chinese | $102,800 | 58% |
| Japanese | $99,700 | 54% |
| Nepalese | $94,800 | 51% |
| Malaysian | $94,100 | 63% |
| Korean | $93,600 | 60% |
| Indonesian | $93,100 | 55% |
| Thai | $82,000 | 49% |
| Bangladeshi | $78,400 | 51% |
| All Asian households | $105,600 | 56% |
Indian-headed households are still the highest earning group, but the order below them has moved. Taiwanese households are now second, and Pakistani households have moved from eighth among these groups on the 2013 to 2015 data to third. Nepalese households have gone from the bottom of the list to the middle. Pew’s figures come from a different survey from the Census Bureau’s yearly report, and are in 2023 dollars, so compare groups within one table rather than across the two.
Why median household income differs between ethnic groups
A few things explain most of the gaps, and none of them is ethnicity on its own.
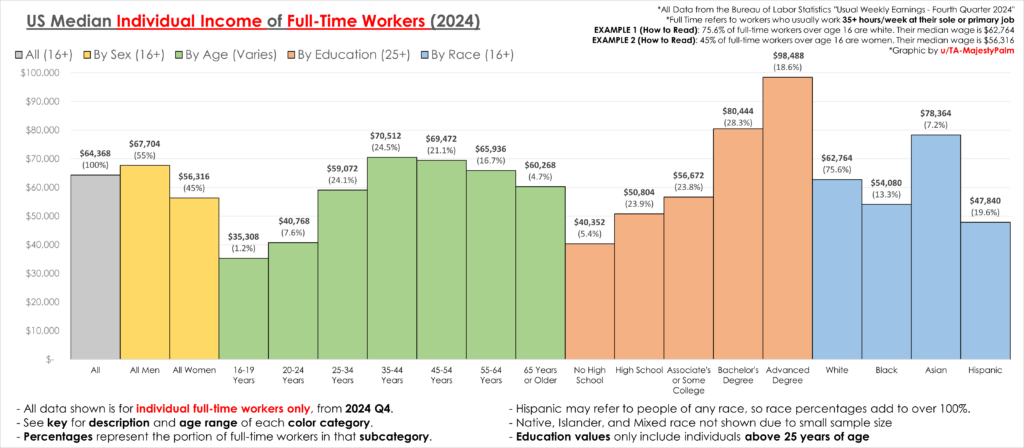
- Education. The groups at the top have very high degree rates. 77% of Indian Americans aged 25 and over have a bachelor’s or higher degree, and 45% have an advanced degree, against 56% for Asian Americans overall [4]. The 2013 to 2015 data on the graphic put the US average at 28%.
- Immigration routes. Many Indian, Taiwanese and Chinese immigrants came on student and skilled worker visas, which select for people who already have degrees and job offers. Groups who arrived mostly as refugees, such as Burmese and Bhutanese Americans, have much lower incomes and degree rates [3].
- Age and household make-up. Household income adds up everyone in the home, so households with two earners, or with adult children still living at home, come out higher. Younger groups and groups with more single-person or retired households come out lower.
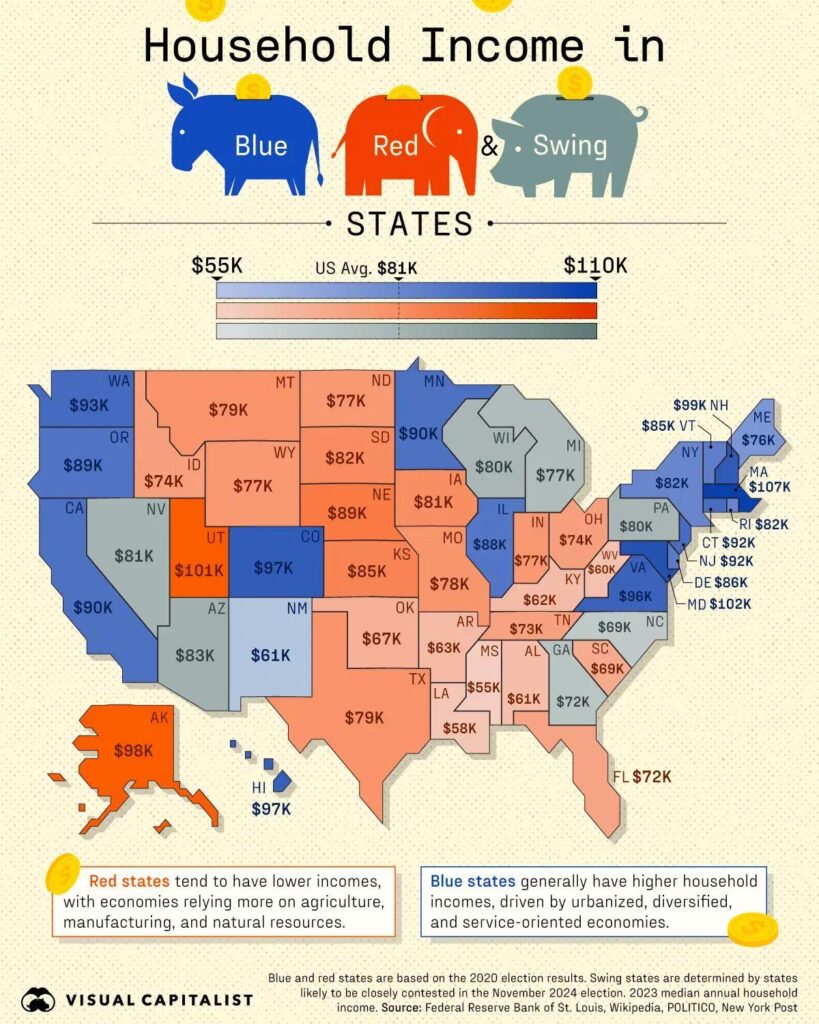
- Where people live. Groups that are concentrated in high-wage, high-cost areas such as California, New York and New Jersey have higher incomes, but a lot of that goes on housing.
- Long-running inequality. The Black and White gap has lasted for decades and reflects differences in wealth, education, segregation and discrimination in the labour market, not only the make-up of households.
Income inequality within ethnic groups
A high median does not mean everyone in a group is well off. Pew found that Asian Americans had the widest income gap of any major racial or ethnic group: in 2016, Asians at the 90th percentile had 10.7 times the income of Asians at the 10th percentile, against 9.8 for Black, 7.8 for White and 7.8 for Hispanic Americans [3]. In 1970 the Asian figure had been 6.1, similar to White Americans. The national origin breakdown shows the same thing from another angle, with some groups well above the national median and others well below it.
How to read median household income figures
- Median, not average. The median is the income of the household in the middle, so a small number of very high earners do not pull it up the way they pull up an average.
- Household, not person. These are totals for everyone living in the home. Per-person earnings tell a different story: Pew gives median personal earnings of $85,300 for Indian Americans aged 16 and over in 2023, against $151,200 for the household [4].
- Race of the householder. Households are grouped by the person who owns or rents the home, so mixed households are counted under one group.
- Hispanic is an ethnicity, not a race. Hispanic people can be of any race, which is why the Census table shows both “White” and “White, not Hispanic”.
- Check the year and the dollars. The 2013 to 2015 figures on the graphic are in dollars of that time and are well below today’s medians, so they are useful for the order of groups but not for current incomes.
Questions about median household income by ethnic group
Which ethnic group has the highest median household income in the US?
Indian Americans. Pew’s figures from the 2023 American Community Survey put the median income of Indian-headed households at $151,200, ahead of Taiwanese ($133,300) and Pakistani ($108,100) households [4]. Among the broad Census race groups, Asian households had the highest median in 2025, at $126,300 [2].
What is the median household income for Black households?
$59,980 in 2025, up 4.8% on 2024 after inflation, according to the Census Bureau [1][2]. That is about 62% of the $96,710 median for non-Hispanic White households.
What is the median household income for Hispanic households?
$73,260 in 2025, which was not significantly different from 2024 after inflation [2].
What is the median household income in the US?
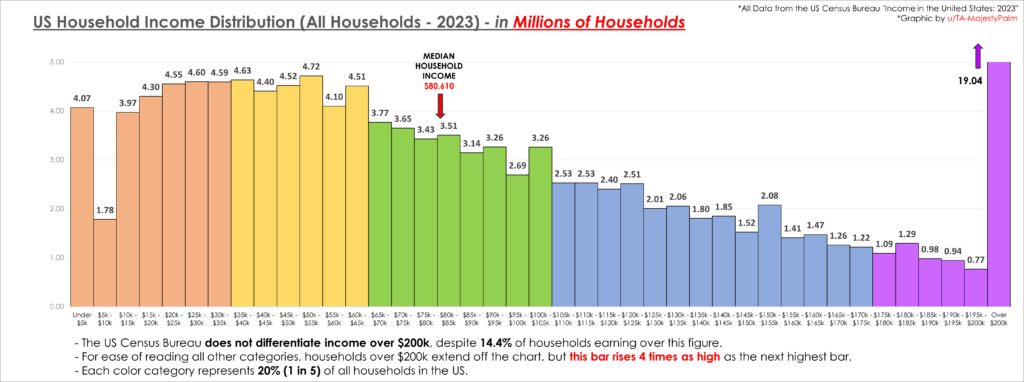
$87,460 in 2025, up 2.6% from $85,210 in 2024 and the highest on record since 1967. After federal and state taxes and credits, the median was $76,060 [1].
Is household income the same as personal income?
No. Household income adds together the income of everyone aged 15 and over living in the home, so it depends on how many earners there are. Personal earnings are lower: for Indian Americans, median personal earnings were $85,300 in 2023, against a household median of $151,200 [4].
Sources
- US Census Bureau, Income, Poverty and Health Insurance Coverage in the United States: 2025, 15 September 2026.
- US Census Bureau, Income in the United States: 2025, Table 1, Income summary measures by selected characteristics.
- Pew Research Center, Income Inequality in the U.S. Is Rising Most Rapidly Among Asians, 12 July 2018.
- Pew Research Center, Asian Americans fact sheets based on the 2023 American Community Survey, including Indians in the U.S., Taiwanese in the U.S. and Pakistanis in the U.S., 1 May 2025.
- India in Pixels, @india.in.pixels on Instagram, the creator of the chart on this page, which cites the US Census Bureau 2013 to 2015 American Community Survey via Equitable Growth.
Last reviewed 6 November 2026