What is point differential in the NFL?
Point differential is the number of points a team has scored minus the number it has allowed, over a game, a run of games or a whole season. A team that wins 30-20 and then loses 17-24 is +10 and then -7, so its point differential is +3. Standings pages show it as “PD” or “Net Pts”, next to points for (PF) and points against (PA) [5].
It is a simple number, but it tells you something the win-loss record can’t: whether a team is winning comfortably or scraping through. Two teams can both be 10-1, one beating opponents by three touchdowns a week and the other winning every game by a field goal. Their records look the same, but most analysts would rate the first team far more highly.
Why point differential matters more than the record
Close games in the NFL come down to a handful of plays: a missed field goal, a fumble at the goal line, a late penalty. Over a season those bounces tend to even out, so a team’s record in one-score games is a weak guide to how it will do next. Margins of victory are more stable, which is why point differential is one of the better simple predictors of future results.
The best known way of turning it into an expected record is the Pythagorean projection, adapted from Bill James’s baseball formula and used in the NFL by Football Outsiders. You raise points scored and points allowed to the power of 2.37, divide points scored by the total, and multiply by 17 games to get “Pythagorean wins” [6]. Football Outsiders found that teams winning at least one full game more than their projection tend to get worse the next year, and teams winning at least one game fewer tend to improve [6].
Take the 2024 Kansas City Chiefs. They scored 385 points and allowed 326 (+59) on the way to a 15-2 record [5]. Their Pythagorean projection works out at about 10 wins, so on that measure they won around five more games than their scoring margin would suggest (our arithmetic from [5] and [6]). The 2024 Detroit Lions, also 15-2, scored 564 and allowed 342 (+222), which projects to about 13 wins [5].
Point differential of NFL teams that started 10-1
Sixty-five teams in NFL history have started a season 10-1. As the infographic by Jayd Pauley shows, using data from Stathead (the Pro-Football-Reference search tool), the 2024 Chiefs reached that mark in November 2024 with a differential of +52, the 64th best of the 65 [1]. Only the 1976 Oakland Raiders, at +41, had a smaller margin at the same stage.
| Team | Point differential at 10-1 | How the season ended |
|---|---|---|
| 1941 Chicago Bears | +249 | Won the NFL championship |
| 1969 Minnesota Vikings | +243 | Lost Super Bowl IV |
| 1948 Chicago Bears | +227 | 10-2, missed the title game |
| 1962 Green Bay Packers | +223 | Won the NFL championship |
| 2024 Detroit Lions (14th of 65) | +177 | 15-2, lost in the divisional round |
| 2023 Philadelphia Eagles | +64 | 11-6, lost in the wild card round |
| 2024 Kansas City Chiefs | +52 | 15-2, lost Super Bowl LIX |
| 1976 Oakland Raiders | +41 | 13-1, won Super Bowl XI |
The Chiefs’ margin was low because nearly every win was close. Their 10 wins in that run were by 1 to 13 points, eight of them by a touchdown or less, and their one defeat, at Buffalo, was by 9 [1]. They kept doing it all year: Wikipedia’s season article notes that 11 of their wins came within one score and that +59 is the worst full-season differential of any team finishing with three or fewer losses since the 1970 AFL-NFL merger, outside the strike-shortened 1982 season [2].
The 1976 Raiders show that a thin margin early on doesn’t rule a team out. They finished 13-1 and beat the Minnesota Vikings 32-14 in Super Bowl XI [3]. The 2024 Chiefs also went deep, beating Houston and Buffalo in the play-offs, but lost Super Bowl LIX 40-22 to the Philadelphia Eagles [2].
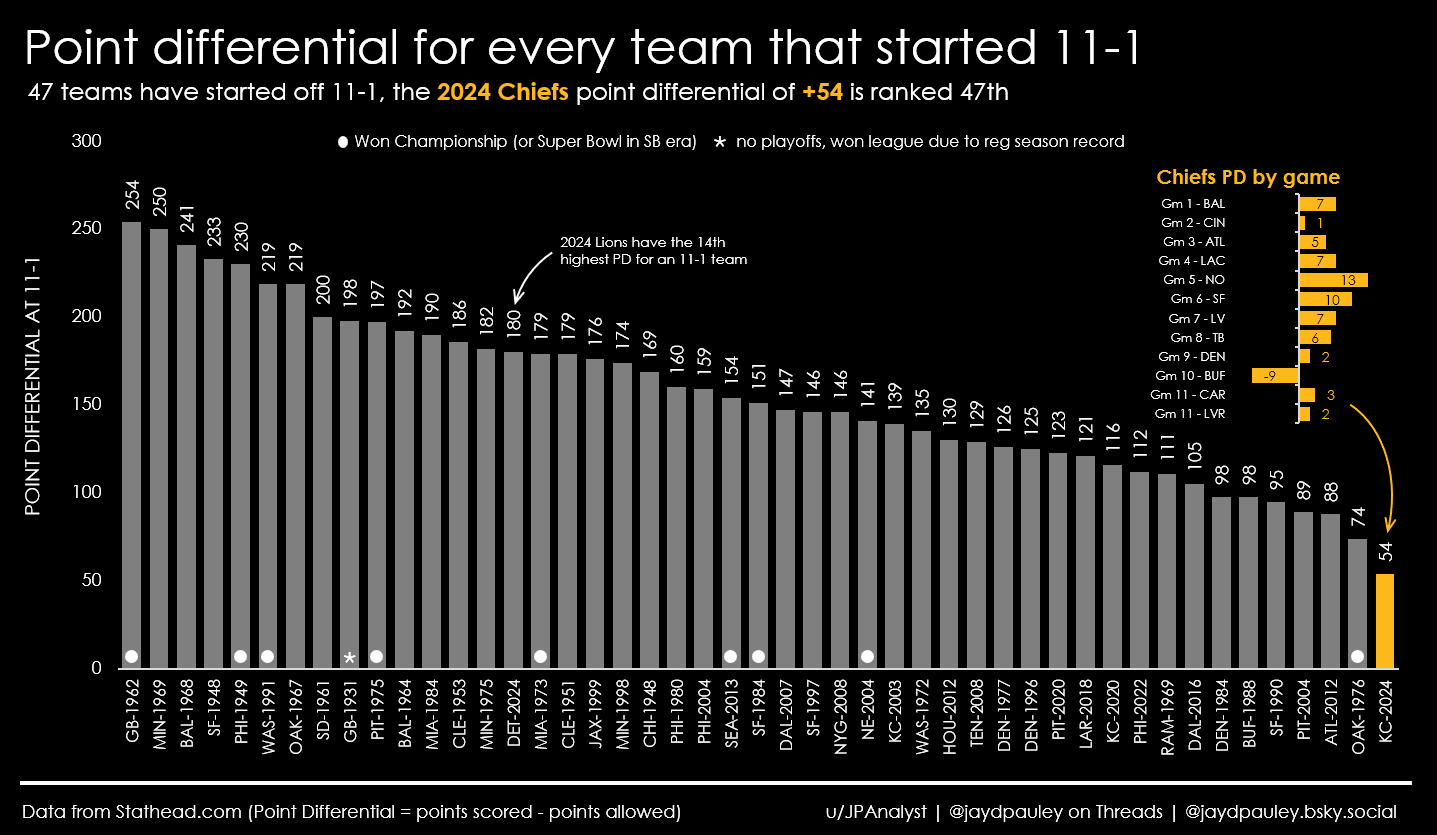
Pauley later made a follow-up version for the 47 teams that started 11-1. The 2024 Chiefs were last of those too, at +54, while the 1962 Packers led at +254 and the 2024 Lions were at +180. On that version of the chart the last row of the Chiefs’ game-by-game inset is labelled “Gm 11” a second time; it is game 12, a 19-17 win over the Las Vegas Raiders (+2).
Does a low point differential catch up with a team?
Often, but not always straight away. The 2024 Chiefs reached the Super Bowl despite their margins. The following season they went 6-11 and missed the play-offs, even though they outscored opponents 362 to 328 (+34) [5]. A positive differential with a losing record means their wins were by bigger margins than their defeats, and on the Pythagorean formula a +34 team would expect around 9 or 10 wins (our arithmetic from [5] and [6]). Injuries and other changes matter too, so you shouldn’t read the whole drop as luck running out, but it is the pattern Football Outsiders describes: teams that win far more close games than their scoring suggests rarely keep doing it [6].
It works the other way as well. A team with a middling record and a strong differential is often better than it looks, and bettors and analysts watch for those teams as likely improvers.
Best and worst point differentials in NFL history
The record for a single season belongs to the 2007 New England Patriots, who went 16-0 in the regular season, scored 589 points and allowed 274, a differential of +315 [4][7]. The worst is the 1976 Tampa Bay Buccaneers, an expansion team that went 0-14 and was outscored 412 to 125, or -287 [8].
| Team | Record | Points for | Points against | Point differential |
|---|---|---|---|---|
| 2007 New England Patriots | 16-0 | 589 | 274 | +315 |
| 1942 Chicago Bears | 11-0 | 376 | 84 | +292 |
| 1999 St. Louis Rams | 13-3 | 526 | 242 | +284 |
| 1961 Houston Oilers | 10-3-1 | 513 | 242 | +271 |
| 1962 Green Bay Packers | 13-1 | 415 | 148 | +267 |
| 1976 Tampa Bay Buccaneers | 0-14 | 125 | 412 | -287 |
| 1981 Baltimore Colts | 2-14 | 259 | 533 | -274 |
| 1990 New England Patriots | 1-15 | 181 | 446 | -265 |
The NFL played 14-game seasons from 1961 to 1977 and 12 games or fewer before that, so the older totals came from fewer games. The 1942 Bears’ +292 in 11 games works out at more than 26 points a game, against 19.7 a game for the 2007 Patriots (our arithmetic from [7]).
Point differential in recent NFL seasons
In 2024 the Detroit Lions led the league at +222, followed by the Eagles (+160) and the Bills and Ravens (+157 each) [5]. In 2025 the Seattle Seahawks led at +191, ahead of the Los Angeles Rams (+172) and the New England Patriots (+170), and Seattle went on to beat New England in Super Bowl LX [5][9]. The team with the best point differential doesn’t always win the title, but it is usually among the favourites.
For the current season, Pro-Football-Reference and the NFL’s own standings pages list every team’s points for, points against and differential, updated after each week’s games [5].
Point differential and NFL tiebreakers
Point differential, which the NFL calls “net points”, is part of the official tiebreaking procedure for division titles and wild card places, but only near the end. For two tied teams in the same division the order runs from head-to-head record, division record, record in common games and conference record through strength of victory, strength of schedule and points rankings. Net points in common games and then net points in all games only come in at steps 9 and 10, just before net touchdowns and a coin toss [10]. In practice it is rarely needed.
Questions about NFL point differential
What is a point differential in football?
It is the points a team has scored minus the points it has allowed. A positive number means the team has outscored its opponents overall, and a negative one means it has been outscored.
What is the best point differential in NFL history?
+315, by the 2007 New England Patriots, who scored 589 points and allowed 274 in a 16-0 regular season [4][7].
What was the Chiefs’ point differential in 2024?
+52 after their 10-1 start, 64th of the 65 teams to start that way, and +59 at the end of a 15-2 regular season [1][2][5].
Is point differential a tiebreaker in the NFL?
Yes, but it comes late. Net points in common games and then in all games are steps 9 and 10 of the two-club tiebreaker, after head-to-head, division, common games, conference record, strength of victory, strength of schedule and points rankings [10].
How do you work out Pythagorean wins in the NFL?
Raise points scored and points allowed to the power of 2.37, divide the points scored figure by the sum of the two, and multiply by the number of games (17 in today’s NFL) [6].
Sources
- Jayd Pauley (u/JPAnalyst), [OC] 65 teams in NFL history have started off 10-1, the 2024 Chiefs point differential of +52 is ranked 64th, r/dataisbeautiful, 24 November 2024. The original post of this infographic.
- Wikipedia, 2024 Kansas City Chiefs season.
- Wikipedia, 1976 Oakland Raiders season.
- Wikipedia, 2007 New England Patriots season.
- Pro-Football-Reference, 2025 NFL standings and team stats and 2024 NFL standings and team stats.
- Wikipedia, Pythagorean expectation, section on the National Football League, citing Football Outsiders Almanac 2011.
- StatMuse, Highest point differential by a team in a season in NFL history.
- StatMuse, Lowest point differential by a team in a season in NFL history.
- Wikipedia, 2025 NFL season.
- NFL, NFL tie-breaking procedures.
Last reviewed 9 November 2026