GDP of the G7 countries in 2025
The G7 is the group of seven large advanced economies: the United States, Japan, Germany, the United Kingdom, France, Italy and Canada. The IMF’s latest World Economic Outlook puts their combined GDP at about $52.7 trillion in 2025 at market exchange rates, or $59.8 trillion once adjusted for purchasing power parity (PPP) [1].
| Country | GDP 2025, nominal ($ trillion) | GDP 2025, PPP (international $ trillion) | Share of G7 GDP at PPP |
|---|---|---|---|
| United States | 30.86 | 30.86 | 51.6% |
| Japan | 4.45 | 7.03 | 11.8% |
| Germany | 5.12 | 6.26 | 10.5% |
| France | 3.38 | 4.58 | 7.7% |
| United Kingdom | 4.01 | 4.57 | 7.6% |
| Italy | 2.55 | 3.74 | 6.3% |
| Canada | 2.32 | 2.79 | 4.7% |
| G7 total | 52.70 | 59.83 | 100% |
Figures are IMF estimates, and shares are our arithmetic from them [1]. The order changes with the measure. In nominal dollars Germany is the second largest G7 economy and the UK is ahead of Japan. At PPP Japan is second and France edges ahead of the UK.
The US is more than half of the G7
The United States is by far the largest G7 economy. Its GDP is larger than the other six members’ combined on either measure, at about 52% of the group’s total at PPP and 59% at market exchange rates in 2025 [1].
The infographic by Visual Capitalist makes the same point with 2024 data. It puts US PPP GDP at $29.2 trillion, 52% of a G7 total of $56.6 trillion [2]. The IMF has since revised those 2024 figures up a little, to $29.4 trillion for the US and $57.4 trillion for the G7, so the US share is now 51.2% [1].
That share has been rising for decades. In 1980 the US made up 41.7% of G7 GDP at PPP. By 2024 it was 51.2%, a rise of about 9.5 percentage points, which matches the graphic’s note that the US share has climbed by 10 points since 1980 (our arithmetic from IMF data) [1][2]. Most of that comes from faster growth. Over the last few years US growth has been well ahead of the rest of the group, at 3.0% in 2024 and an estimated 2.3% in 2025, against near zero growth in Germany and Japan in 2024 [1].
Nominal GDP and PPP GDP, what the difference means
Nominal GDP converts each country’s output into US dollars at market exchange rates. It is the right measure for comparing what economies are worth in global markets, for example in trade or debt.
PPP GDP adjusts for the fact that prices differ between countries. A haircut, a train ticket or a restaurant meal costs less in Rome than in New York, so a euro of income buys more in Italy than its exchange rate suggests. The IMF converts GDP into international dollars, which have the same buying power in every country as a US dollar has in the US [3]. That is why US GDP is identical on both measures, while Japan, Italy and France look much larger at PPP.
Japan shows the difference most clearly. Its nominal GDP of $4.45 trillion in 2025 is lower than it was in 1995 ($5.64 trillion), partly because of a weaker yen, but at PPP its economy is worth $7.03 trillion, the second largest in the G7 [1].
The G7’s falling share of the world economy
The G7 is still the richest group of countries, but its share of world output has fallen a long way. At PPP it produced 52% of world GDP in the mid 1980s, 46% in 1995 and 29% in 2024. The IMF expects 28% in 2026 [1].
| Year | G7 share of world GDP at PPP | G7 share of world GDP, nominal |
|---|---|---|
| 1980 | 51.8% | 61.3% |
| 1995 | 46.0% | 65.5% |
| 2010 | 35.6% | 49.5% |
| 2024 | 28.9% | 44.6% |
| 2026 (forecast) | 28.0% | 43.3% |
These shares are our arithmetic from the IMF’s figures for the seven members and the world [1]. The graphic says the G7 reached a peak of 45% of the global economy in 1995 [2]. That does not match current IMF data, which has the G7 share at PPP at its highest in 1985 (52.2%) and already falling by 1995. On nominal figures the peak was in 1986, at 68% [1].
The decline is mostly about China and India growing fast rather than the G7 shrinking. China’s GDP at PPP was $41.3 trillion in 2025, about a third larger than the US, and China and India together ($58.6 trillion) are now almost the size of the whole G7 on this measure [1].
GDP per person in the G7
Total GDP mostly reflects population. Per person, the gaps are smaller and the ranking changes. On IMF estimates for 2025 at PPP, GDP per person was about $90,300 in the US, $74,900 in Germany, $67,100 in Canada, $66,600 in France, $65,800 in the UK, $63,500 in Italy and $57,000 in Japan [1]. GDP per person is not the same as living standards, since it ignores how income is shared and factors such as health and working hours.
G7 economic growth in 2026
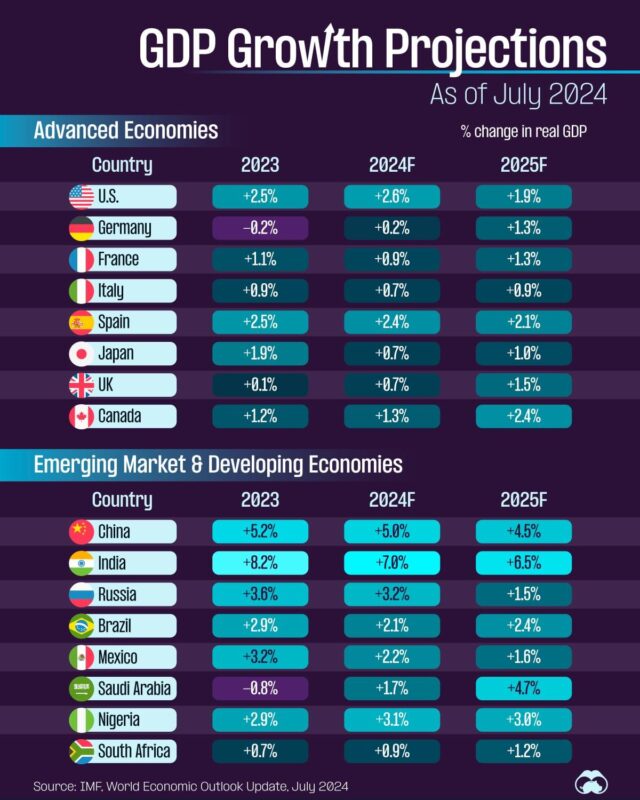
The IMF expects growth in 2026 of 2.3% in the US, 1.3% in Germany and the UK, 1.1% in Canada, 0.8% in Italy, 0.7% in Japan and 0.4% in France, against 3.1% for the world economy as a whole [1]. Forecasts are revised twice a year, so treat these as a guide.
Questions about G7 countries GDP
What is the combined GDP of the G7?
About $52.7 trillion in 2025 at market exchange rates, around 44% of world GDP. At PPP it is about $59.8 trillion, around 28% of the world total [1].
Which is the richest G7 country?
The United States, both in total GDP and in GDP per person, at about $90,300 per person at PPP in 2025 [1].
Which G7 country has the smallest economy?
Canada, at $2.32 trillion nominal and $2.79 trillion at PPP in 2025 [1].
Is China in the G7?
No. China’s economy is the largest in the world at PPP and second largest in nominal terms, but the G7 is a group of advanced democracies and China is not a member. Russia was a member from 1998 until it was suspended in 2014 over its annexation of Crimea [4].
Is the EU part of the G7?
The European Union has taken part fully in the G7 since 1981 as a nonenumerated member, represented by the presidents of the European Council and the European Commission. It is not counted as one of the seven [4].
Sources
- International Monetary Fund, World Economic Outlook DataMapper, GDP at current prices, GDP at PPP, GDP per capita and real GDP growth, accessed 10 November 2026.
- Visual Capitalist, The G7 is Looking More and More American, Voronoi, using The Economist and IMF data for 2024.
- International Monetary Fund, Purchasing Power Parity, weights matter, Finance and Development.
- Council on Foreign Relations, What Does the G7 Do?
Last reviewed 10 November 2026