Key points from the chart
- Netflix is the most profitable of the six major media companies on the chart, with a net profit margin of 16.0%: 16 cents of profit for every dollar of revenue.
- Fox is second at 10.7%, then Sony at 7.5% and Disney at 5.4%.
- Disney has the largest revenue ($91.4 billion) and Sony the largest profit ($6.3 billion), but both have thinner margins than Netflix.
- Paramount (minus 2.1%) and Warner Bros. (WBD, minus 7.6%) both made a loss.
- The chart notes that Disney’s parks business contributed 60% of its profits.
Most profitable media companies in text
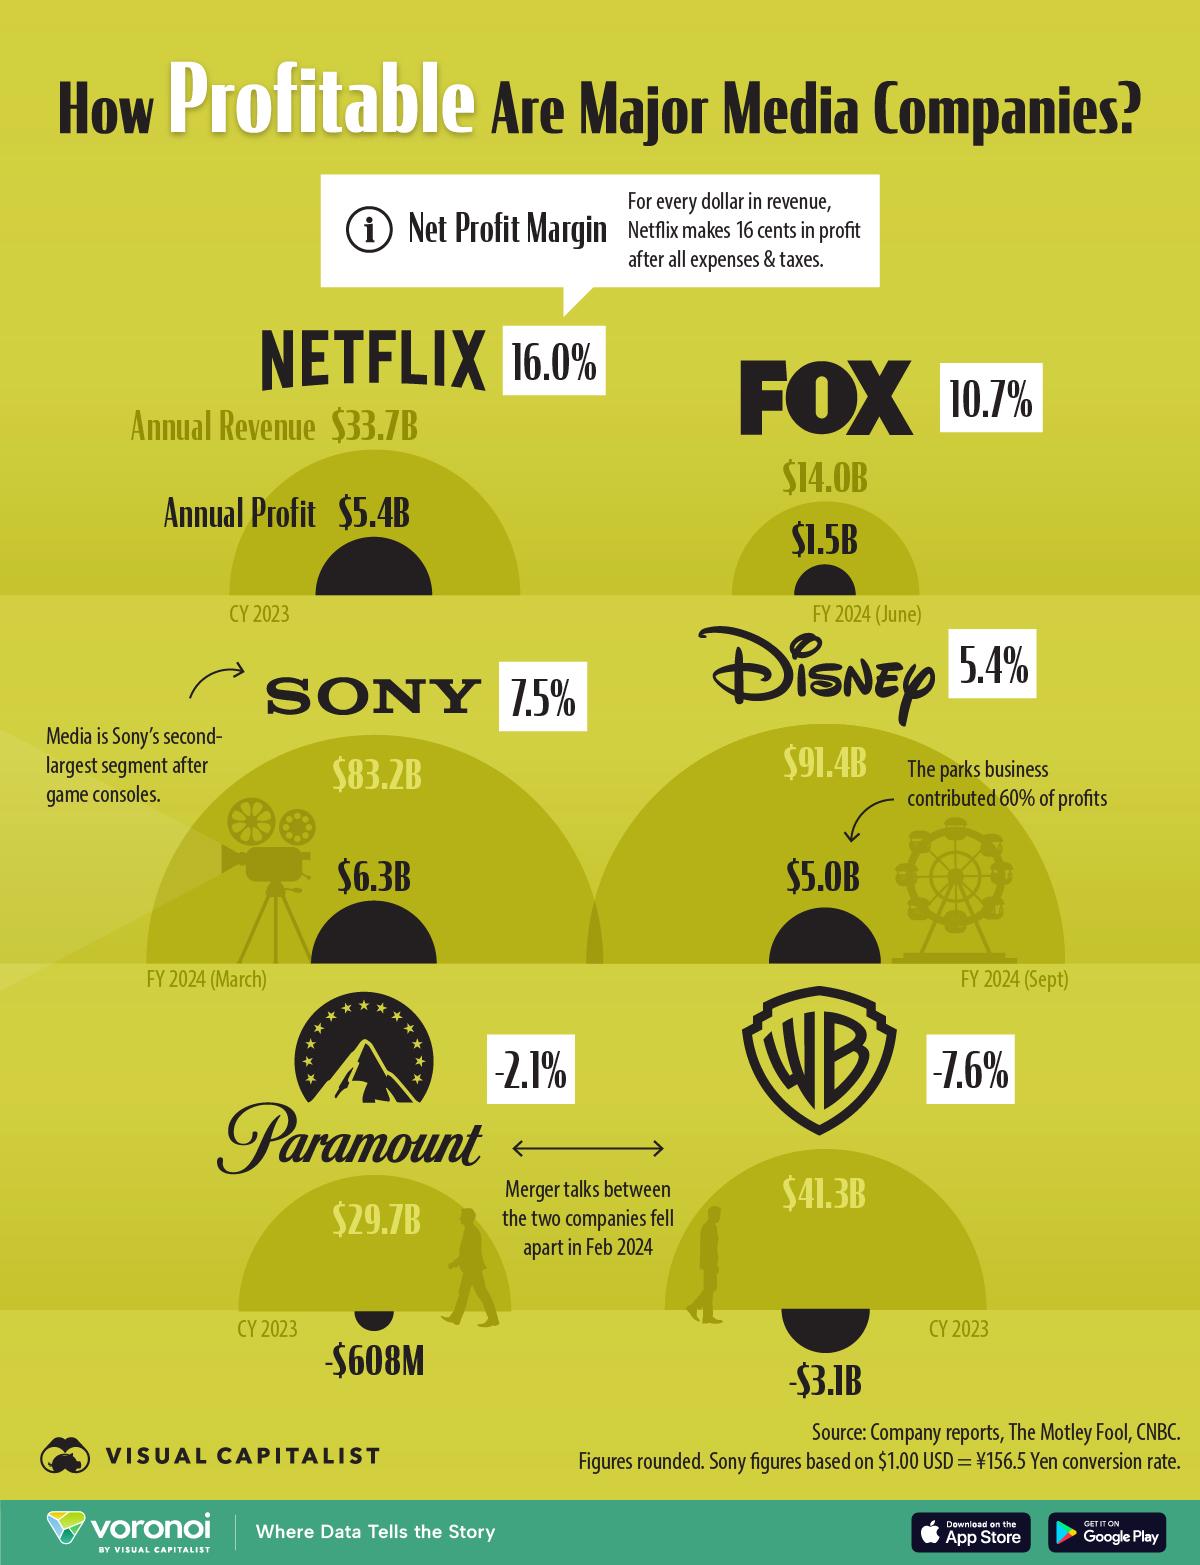
Title: How Profitable Are Major Media Companies? Each company has a large semicircle for annual revenue with a smaller black semicircle inside for annual profit; for the two loss making companies the profit semicircle hangs below the line. An explainer box on Netflix defines net profit margin: for every dollar in revenue, Netflix makes 16 cents in profit after all expenses and taxes.
| Rank | Company | Net profit margin | Annual revenue | Annual profit | Period |
|---|---|---|---|---|---|
| 1 | Netflix | 16.0% | $33.7B | $5.4B | Calendar year 2023 |
| 2 | Fox | 10.7% | $14.0B | $1.5B | Financial year 2024 (to June) |
| 3 | Sony | 7.5% | $83.2B | $6.3B | Financial year 2024 (to March) |
| 4 | Disney | 5.4% | $91.4B | $5.0B | Financial year 2024 (to September) |
| 5 | Paramount | -2.1% | $29.7B | -$608M | Calendar year 2023 |
| 6 | Warner Bros. (WBD) | -7.6% | $41.3B | -$3.1B | Calendar year 2023 |
Notes on the graphic: Media is Sony’s second largest segment after game consoles. The parks business contributed 60% of profits (Disney). Merger talks between the two companies fell apart in Feb 2024 (Paramount and Warner Bros.). Source: Company reports, The Motley Fool, CNBC. Figures rounded. Sony figures based on $1.00 USD = ¥156.5 conversion rate. Visual Capitalist and Voronoi logos.
Why the margins differ
Net profit margin is profit after all expenses and taxes divided by revenue. A company can have very large revenue and still a low margin, which is the case for the two biggest companies on the chart. Visual Capitalist points out that Sony and Disney are both more diversified than Netflix: parks and experiences for Disney, and gaming consoles and technology for Sony [1].
Disney’s own results show how much the parks matter. For the financial year to 28 September 2024, Disney reported revenue of $91.4 billion and net income attributable to Disney of $4,972 million [3]. Its Experiences segment, which includes the parks, made $9,272 million of the $15,601 million total segment operating income [3], about 59%, which the chart rounds to 60%. Segment operating income is a measure before some company wide costs and taxes, so it is not the same as the net profit used for the margin.
At the other end, Visual Capitalist describes Paramount and Warner Bros. (WBD) as pure play media companies that are losing money, saying both have lost core business revenue as cord cutting continues while their streaming platforms have not yet delivered [1]. It adds that a proposed merger between the two fell apart in February 2024 [1], which the chart illustrates with two figures walking away from each other.
Notes on this infographic
- Different years. The six companies report on different calendar and financial years, so the figures are each company’s latest full year at the time, not the same 12 months. Netflix, Paramount and Warner Bros. (WBD) are for calendar 2023, Sony for the year to March 2024, Fox for the year to June 2024 and Disney for the year to September 2024.
- Fox’s year end. The graphic labels Fox’s figures FY 2024 (June). The text of the Visual Capitalist article says Fox’s financial year ended in March 2024 [1]. Fox Corporation’s financial year ends on 30 June [4], so the graphic’s June label is the correct one.
- Sony. Sony reports in yen, so its figures depend on the exchange rate used (¥156.5 to the dollar). Its profit covers the whole group, including games, electronics and financial services, not only media.
- Rounding. Because revenue and profit are rounded, recalculating a margin from them can differ slightly from the printed margin. Sony’s $6.3 billion over $83.2 billion, for example, gives about 7.6% against the printed 7.5%.
Questions about media company profits
Are media companies profitable?
Four of the six on this chart were profitable in their latest full year, with net margins from 5.4% (Disney) to 16.0% (Netflix). Paramount and Warner Bros. (WBD) made losses of $608 million and $3.1 billion [1].
How do media companies make money?
The chart shows that for the biggest companies, media is only part of the business. Disney’s parks contributed about 60% of its profits [3], and the chart notes that media is Sony’s second largest segment after game consoles. Visual Capitalist contrasts these diversified companies with pure play media companies such as Paramount and Warner Bros. (WBD), which depend on television and streaming [1].
Which media company has the highest profit margin?
Netflix has the highest net profit margin of the six major media companies on the chart, 16.0% for calendar year 2023, or 16 cents of profit for every dollar of revenue. It made $5.4B of profit on $33.7B of revenue. Fox is second at 10.7%, then Sony at 7.5% and Disney at 5.4%.
Why are Paramount and Warner Bros. losing money?
Paramount had a net profit margin of -2.1% in calendar year 2023, a loss of $608M, and Warner Bros. (WBD) -7.6%, a loss of $3.1B. Visual Capitalist says both have lost core business revenue as cord cutting continues, while their streaming platforms have not yet delivered [1]. A proposed merger between the two fell apart in February 2024 [1].
Sources
- Visual Capitalist, Ranked, Major Media Companies, by Profit Margin, the article for this chart, with links to each company’s reports.
- Voronoi by Visual Capitalist, Media is a Tough Business for Profits, Unless You are Netflix (2 January 2025), where the chart was first posted.
- The Walt Disney Company, Fourth quarter and full year earnings for fiscal 2024 (14 November 2024).
- Wikipedia, Fox Corporation, which cites Fox’s annual reports for fiscal years ended 30 June.
Last reviewed 29 October 2026