Which religion is largest in each US county?
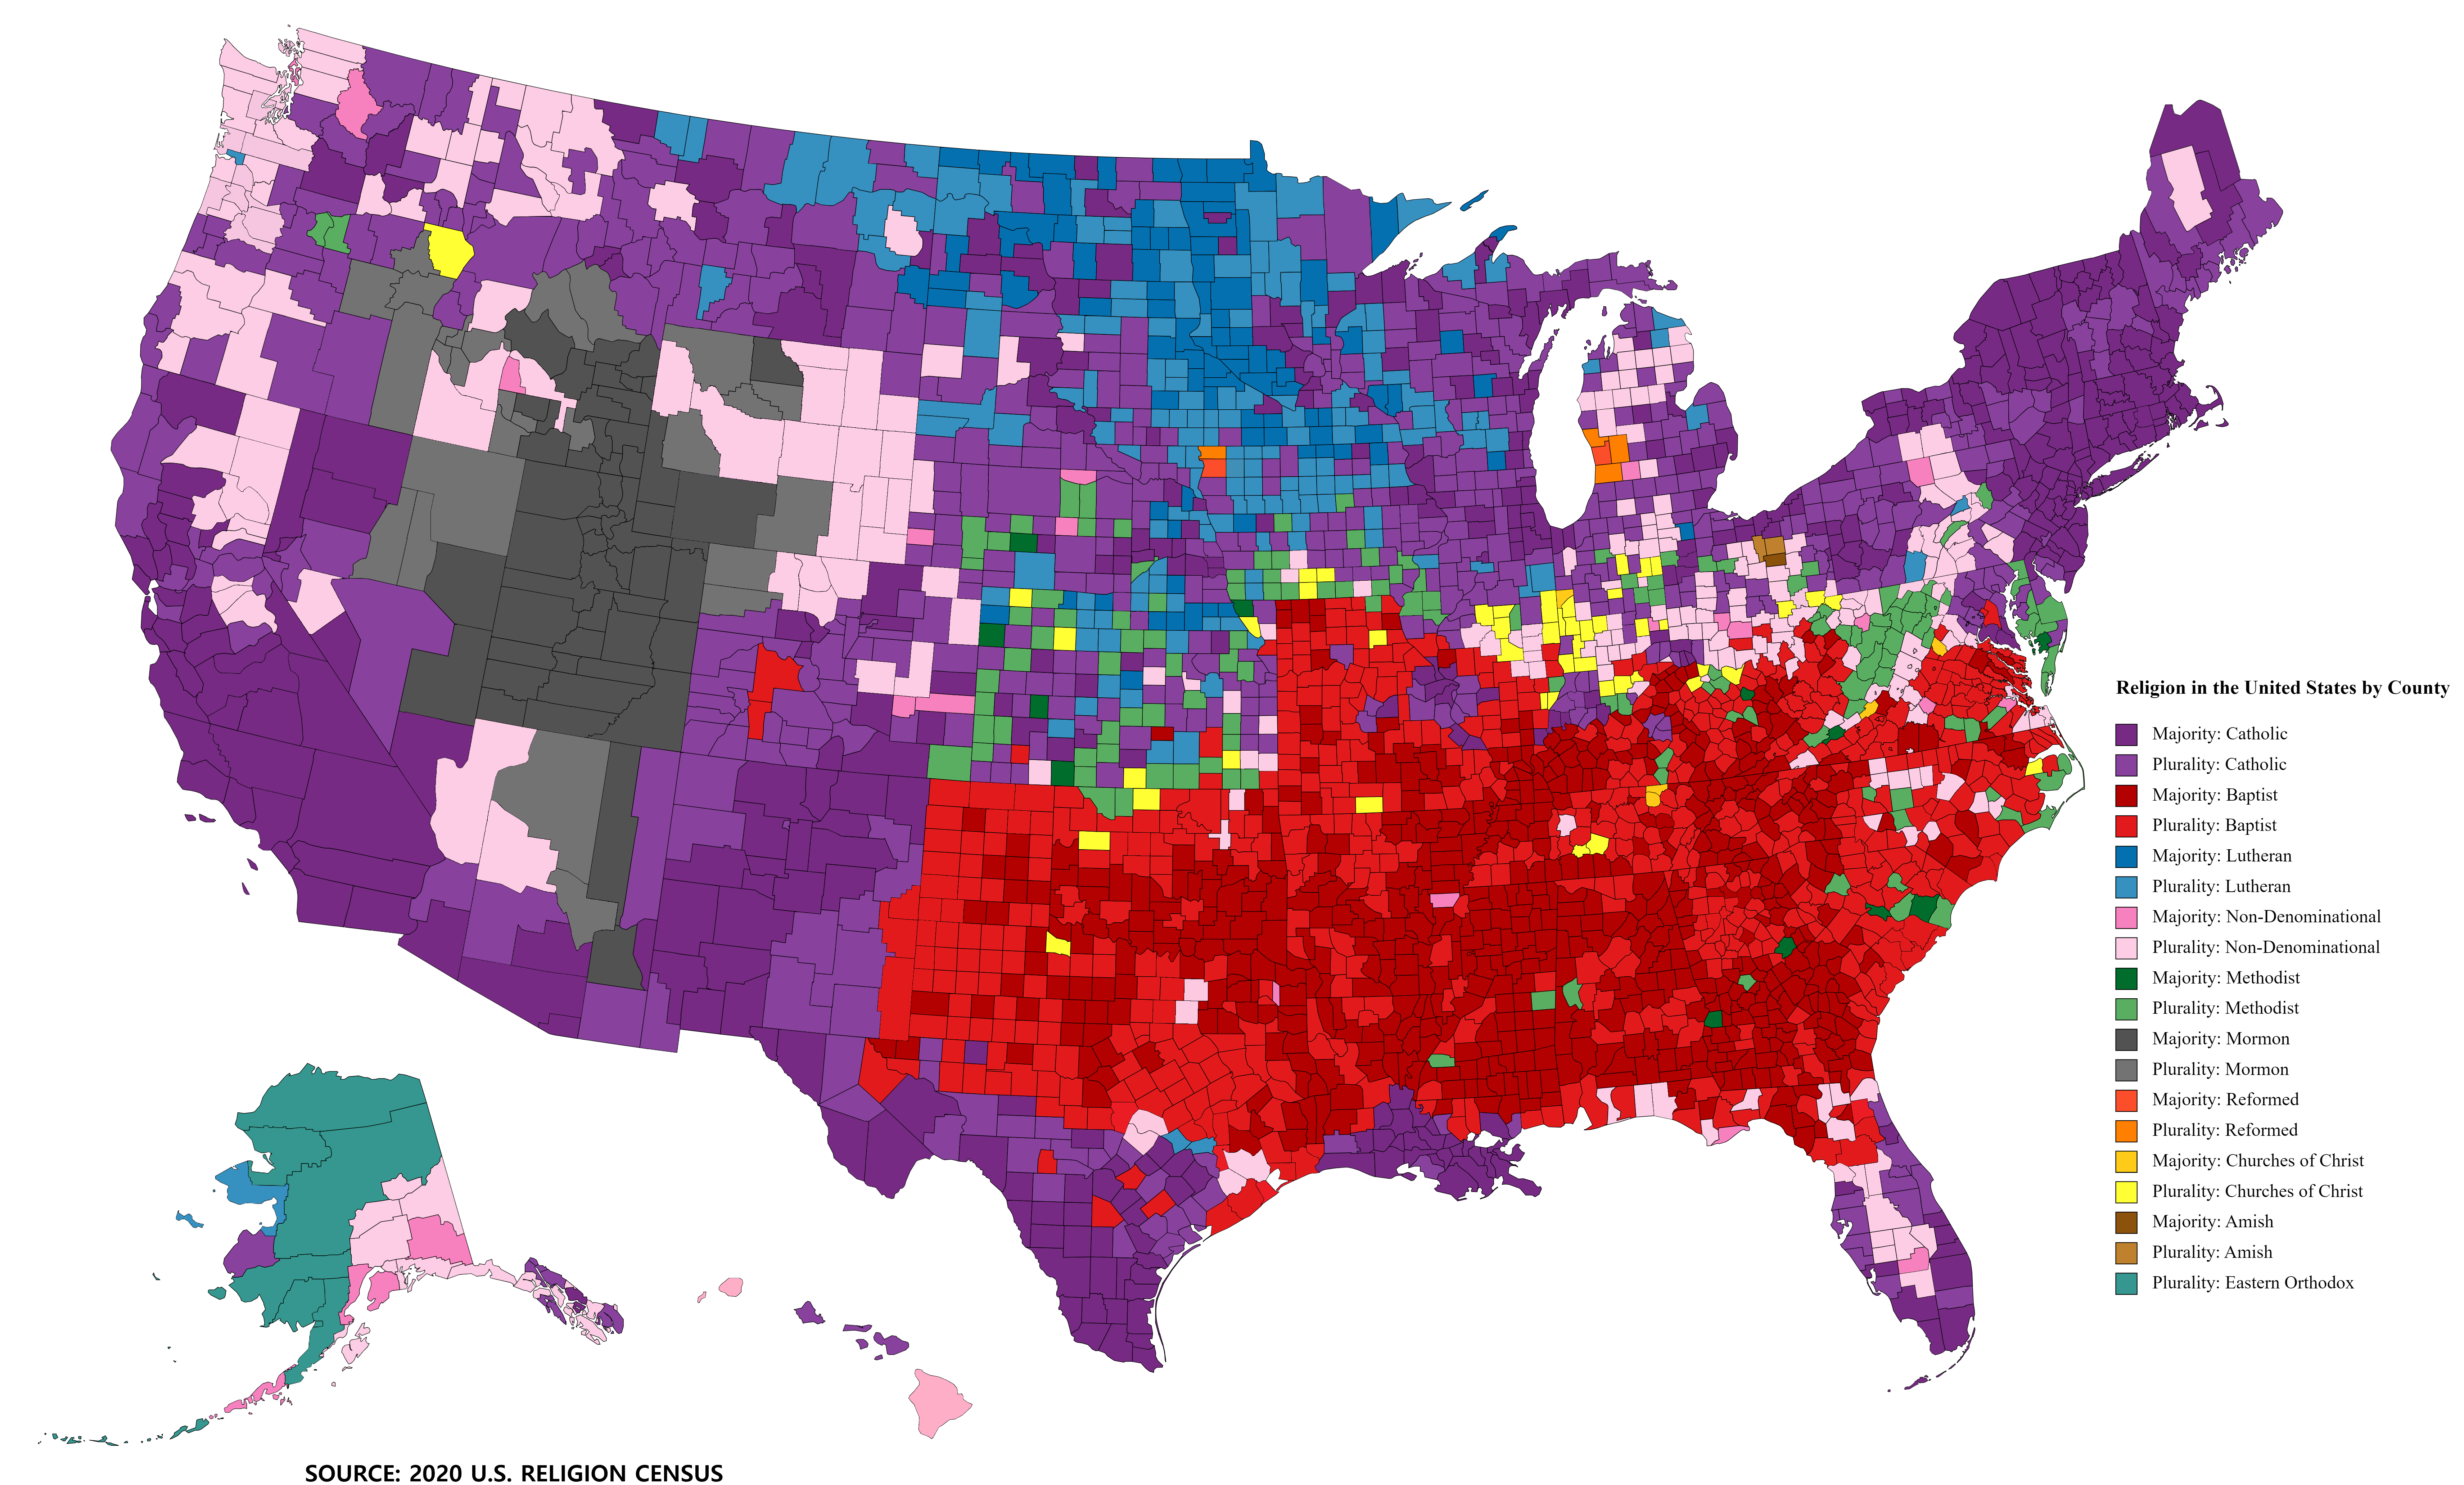
On a US religion map by county, two groups cover most of the country. Catholics are the largest group in the Northeast, the Southwest, California and much of the Midwest, and Baptists lead across the South. Lutherans lead in the Upper Midwest, Latter-day Saints in Utah and southern Idaho, and Eastern Orthodox churches in parts of Alaska.
The infographic by Mission-Guidance4782 shows this from the 2020 U.S. Religion Census, the once a decade count of congregations and their members in every county [1][2]. The census’s own map of major religious families puts Baptists first in 1,111 counties and Catholics first in 1,071, so the two are close to level on county count, even though Catholics have far more members [3].
The main religious regions of the United States
The county pattern follows settlement history more than anything else. Each region’s largest group is the church its early settlers or later immigrants brought with them.
| Region | Largest group | Why |
|---|---|---|
| Northeast and Great Lakes | Catholic | Irish, Italian, Polish and other European Catholic immigration to industrial cities |
| Southwest, California, south Texas | Catholic | Spanish and Mexican heritage and recent Latin American immigration |
| South Louisiana | Catholic | French and Acadian (Cajun) settlement |
| The South, from east Texas to Virginia | Baptist | Southern Baptist and historically Black Baptist churches, the core of the Bible Belt |
| Minnesota, the Dakotas, parts of Iowa and Wisconsin | Lutheran | German and Scandinavian settlement |
| Utah, south east Idaho, parts of Nevada, Wyoming and Arizona | Latter-day Saints | Mormon settlement from the 1840s |
| Kansas, Nebraska, the Delmarva Peninsula, parts of West Virginia | Methodist | Methodist circuit riders followed the frontier |
| Western Michigan and north west Iowa | Reformed | Dutch settlement |
| Western and south western Alaska | Eastern Orthodox | Russian Orthodox missions from the colonial period |
Non-denominational churches lead in a growing number of counties, especially in the Pacific Northwest, the Mountain West and parts of Florida and the Midwest. Churches of Christ lead in scattered counties in Tennessee and Kentucky, and the Amish in a small part of Ohio around Holmes County.
What the 2020 U.S. Religion Census counts
The census is run by the Association of Statisticians of American Religious Bodies. For 2020 it collected data from 372 religious bodies and counted 356,642 congregations in 3,141 of the 3,143 US counties, with 161.2 million adherents [2]. Adherents means people linked to a congregation, including children and members who are not regular attenders.
That last point matters when you read the map. The census counts congregations and their members, not how individuals describe themselves. Its adherents add up to 48.6% of the US population, while surveys find far more Americans who say they have a religion [2]. People with no religion are left out entirely. So a county shown as Catholic means Catholics are the largest group among people in congregations, not that most residents are Catholic.
It also depends on how groups are combined. Most county maps join many separate bodies into families such as Baptist, Methodist or Lutheran. The census counts the Southern Baptist Convention and the National Baptist Convention, USA separately, for example, and the Evangelical Lutheran Church in America separately from the Lutheran Church Missouri Synod, but most maps show each family as one colour [2]. The census’s own family map also leaves a county blank when no family reaches 25% of adherents, which happens in 181 counties [3].
The largest religious bodies in the US
Which body is biggest depends on what you measure [2].
- By members, the Catholic Church is largest, with about 61.9 million adherents, 38.4% of all adherents in the census.
- By congregations, the Southern Baptist Convention is largest, with 51,379 churches, 14.4% of all congregations.
- By reach, the United Methodist Church is the most widespread, with congregations in 2,989 counties, about 95% of the total.
Non-denominational churches are the second-largest group by adherents and congregations. Between 2010 and 2020 they added nearly 9,000 congregations and nearly nine million adherents [2]. The census also counted 2,771 mosques with about 4.5 million Muslim adherents, up by nearly 1.9 million since 2010 [2].
The most and least religious states
Measured by the share of people who belong to a congregation, the most religious states in 2020 were Utah (76.1%), Alabama (63.6%), Louisiana (63.3%), Oklahoma (61.2%) and Mississippi (59.4%). The least were New Hampshire (27.2%), Maine (30.8%), Oregon (33.2%), Montana (34.8%) and Alaska (35.2%) [2].
Utah is the only state where one body makes up most of the whole population. Latter-day Saints are about 65% of Utah’s residents and 85.4% of its religious adherents. Catholics are 78.8% of adherents in Rhode Island and 73.0% in Massachusetts [2].
How American religion has changed since 2020
Survey data gives the wider picture. Pew Research Center’s 2023 to 2024 Religious Landscape Study found 62% of US adults identify as Christian, down from 78% in 2007, with 40% Protestant and 19% Catholic. The share with no religion was 29%, up from 16% in 2007 [4]. Pew found the decline has slowed and may have levelled off since about 2019 [4]. PRRI’s 2025 Census of American Religion puts the unaffiliated at 28% and weekly church attendance at 26%, down from 31% in 2013 [5].
The next U.S. Religion Census is due for 2030, so county maps based on 2020 data are still the most detailed available.
Questions about the US religion map by county
What is the most common religion in US counties?
Christian churches lead in nearly every county. Among individual families, Baptists lead in the most counties (1,111) and Catholics in nearly as many (1,071) on the census’s own map [3].
Which states are mostly Catholic?
Catholics make up the largest share of religious adherents in the Northeast, especially Rhode Island (78.8%), Massachusetts (73.0%) and New Jersey (61.3%) [2]. They also lead in much of California, the Southwest and south Louisiana.
Where is the Bible Belt?
Roughly the area where Baptists are the largest group, from east Texas and Oklahoma across Arkansas, Tennessee, Kentucky and the Deep South to the Carolinas and Virginia. Conservative Protestants make up more than 30% of the whole population in Alabama, Oklahoma, Mississippi, Arkansas, Tennessee and Kentucky [2].
Why is Alaska Orthodox on religion maps?
Russian Orthodox missionaries converted many Alaska Native communities before the US bought Alaska in 1867, and those parishes remain. Lake and Peninsula Borough is one of seven counties where the census found only one religious body, the Orthodox Church in America [2].
Where can I see religion data for my county?
The U.S. Religion Census website has county maps and data downloads, and the Association of Religion Data Archives (ARDA) publishes county reports from the same data [1][2].
Sources
- Reddit r/Maps, Religion in the U.S. by County (2020 Data), u/Mission-Guidance4782.
- Association of Statisticians of American Religious Bodies, 2020 U.S. Religion Census, Religious Congregations and Adherents Study (PDF), 2023.
- Glenmary Research Center, Major Religious Families by Counties of the United States, 2020 (PDF).
- Pew Research Center, Decline of Christianity in the U.S. Has Slowed, May Have Leveled Off, February 2025.
- PRRI, 2025 PRRI Census of American Religion, April 2026.
Last reviewed 10 November 2026