What is the M2 money supply?
The M2 money supply is the Federal Reserve’s broad measure of the money held by US households and businesses: cash, checking and savings deposits, small time deposits under $100,000 and retail money market funds. M2 stood at $23.41 trillion in September 2026, a record high, after rising 5.7% over the previous 12 months, according to Federal Reserve data published on FRED [1][2].
The chart by Econovis puts M2 next to the S&P 500 from 1970 to November 2024, with both rebased to the same starting point so you can compare their growth. It is one of the most shared ways of asking whether stock prices are simply tracking the amount of money in the economy.
What M2 includes
The Fed publishes several measures of money in its H.6 release, each wider than the last [1].
| Measure | What it includes |
|---|---|
| Monetary base | Currency in circulation plus the reserves banks hold at the Federal Reserve |
| M1 | Currency held by the public plus checking accounts and other very liquid deposits (including savings deposits since May 2020) |
| M2 | M1 plus small time deposits (under $100,000) and retail money market fund shares |
In May 2020 the Fed removed the monthly limit on savings account withdrawals, so savings deposits were reclassified from the rest of M2 into M1 [2]. That made M1 jump by about $11 trillion overnight but did not change M2, which is one reason analysts now use M2 for long-run comparisons.
M2 money supply by year
These are the seasonally adjusted figures for January of each year (September for 2026), from the Federal Reserve via FRED [2].
| Year | M2 (trillion dollars) |
|---|---|
| 1970 | 0.59 |
| 1980 | 1.48 |
| 1990 | 3.17 |
| 2000 | 4.67 |
| 2008 | 7.51 |
| 2020 (February) | 15.49 |
| 2022 (March, pandemic peak) | 21.77 |
| 2023 (October, low point) | 20.71 |
| 2026 (September) | 23.41 |
M2 grew about 36 times between January 1970 and November 2024, the period the chart covers. Most of the time it rises steadily by a few per cent a year. The big exception was the pandemic. Government support payments, Fed bond buying and people saving more pushed M2 up by 40% between February 2020 and its peak in March 2022, and annual growth hit 26.8% in February 2021, the fastest on record since the series began in 1959 [2].
Then M2 shrank. As the Fed raised interest rates and reduced its bond holdings, M2 fell by about 4.9% to $20.71 trillion in October 2023, and from late 2022 to early 2024 it was lower than a year earlier, the only time that has happened since 1959 [2]. It started growing again from late 2023 and passed its 2022 peak in May 2025.
M2 money supply vs the S&P 500
Over long periods, stock prices and the money supply have both risen because the economy has grown and prices have risen. That is the basic reason the two lines on the infographic follow a similar path. More money in bank accounts and money market funds can also find its way into shares, especially when interest rates are low.
The relationship is loose, though, and the gaps between the two lines are where the chart is most useful. The S&P 500 pulled well ahead of M2 in the late 1990s and fell back after the dot-com crash. It moved roughly in step during the mid-2000s, fell behind in the 2008 financial crisis and took until the late 2010s to catch up. Both then rose sharply in the pandemic.
The most striking stretch is 2022 to 2024. M2 fell from March 2022 to October 2023, but the S&P 500 recovered from its October 2022 low of 3,577 to over 6,000 by November 2024 [3]. Econovis put the gap down to factors beyond the money supply, such as the rise of AI stocks and investor sentiment [4]. Bear in mind M2 was already growing again by the time the chart ends, so the S&P was not rising against a shrinking money supply for the whole period.
S&P 500 to M2 ratio
Dividing the S&P 500 by M2 gives a rough guide to how far shares have run ahead of the money supply. Using index points per trillion dollars of M2 (our calculation from the closing prices and Fed figures below), the measure has moved like this [2][3]:
| Date | S&P 500 close | M2 (trillion dollars) | S&P 500 points per trillion of M2 |
|---|---|---|---|
| March 2000 (dot-com peak) | 1,527 | 4.71 | 324 |
| October 2007 (pre-crisis peak) | 1,565 | 7.43 | 211 |
| March 2009 (crisis low) | 677 | 8.38 | 81 |
| February 2020 (pre-pandemic peak) | 3,386 | 15.49 | 219 |
| October 2022 (bear market low) | 3,577 | 21.44 | 167 |
| November 2024 (end of the chart) | 6,001 | 21.43 | 280 |
| October 2026 (record close) | 7,819 | 23.41 | 334 |
On this measure, the S&P 500 at the end of the chart was high but still below its 2000 level. Since then shares have kept rising faster than M2. The S&P 500 closed at a record 7,818.93 on 6 October 2026, which takes the ratio above its dot-com peak [3]. A high ratio does not tell you when or whether shares will fall. After 2000 the ratio dropped sharply, but there were also long periods when it stayed high.
Does M2 growth cause inflation?
Sometimes. The Fed says money supply measures have, over some periods, had close links with nominal GDP and the price level, but they are only one part of the data policymakers look at [1]. From the 1990s until the pandemic the link with inflation was weak, so M2 got little attention.
The pandemic revived interest in it. M2’s record growth in 2020 and 2021 was followed by US consumer price inflation of 9.1% in June 2022, the highest since 1981 [5]. Many economists think the extra money played a part, along with supply chain problems and higher energy prices. How fast money changes hands matters too. The velocity of M2 (GDP divided by M2) fell to a record low of 1.13 in the second quarter of 2020 and was 1.42 in mid-2026, still well below its 1997 high of 2.19 [6].
Questions about the M2 money supply
What is the current value of M2?
US M2 was $23.41 trillion in September 2026, seasonally adjusted, the latest monthly figure. The Fed updates it every month, and the next release is due on 24 November 2026 [2].
How does the M2 money supply increase?
Mostly through bank lending, because when a bank makes a loan it creates a new deposit. M2 also rises when the Fed buys bonds (quantitative easing), when the government runs large deficits paid into people’s bank accounts, and when people move money into retail money market funds. It falls when loans are repaid faster than new ones are made, when the Fed shrinks its balance sheet, or when deposits move into assets outside M2, such as Treasury bills.
What is the difference between M1 and M2?
M1 is money you can spend straight away: cash, checking accounts and, since May 2020, savings deposits. M2 adds less liquid savings, namely small time deposits such as certificates of deposit under $100,000 and retail money market funds [1].
Why did the M2 money supply fall in 2022 and 2023?
The Fed raised interest rates quickly from March 2022 and began shrinking its balance sheet. Higher rates made Treasury bills and other assets outside M2 more attractive than bank deposits, and bank lending slowed. M2 fell for the first time in the series’ history, then started rising again in late 2023 [2].
Is there a global M2?
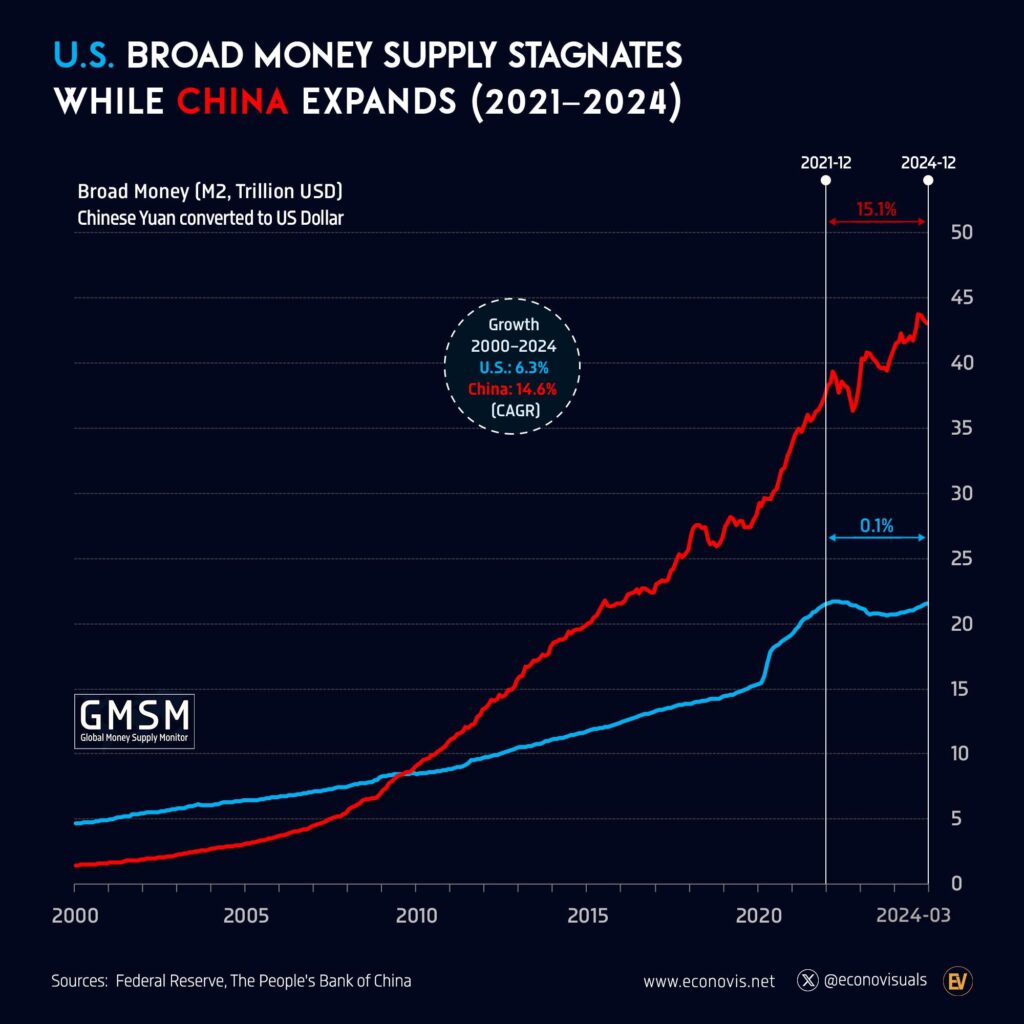
Not an official one. Charts of global M2 add together the M2 figures of the largest economies, converted into dollars, so they move with exchange rates as well as with money growth.
Sources
- Federal Reserve, What is the money supply? Is it important?
- Board of Governors of the Federal Reserve System, M2 (M2SL), FRED, Federal Reserve Bank of St. Louis, data to September 2026.
- S&P Dow Jones Indices, S&P 500 (SP500), FRED, daily closes; earlier historic closes from S&P Dow Jones Indices.
- Econovis, S&P 500 vs U.S. M2 Money Supply, Convergence and Divergence (1970 to 2024), Voronoi, 17 November 2024. The original post of this graphic.
- U.S. Bureau of Labor Statistics, Consumer Price Index for All Urban Consumers, FRED.
- Federal Reserve Bank of St. Louis, Velocity of M2 Money Stock (M2V), FRED.
Last reviewed 9 November 2026