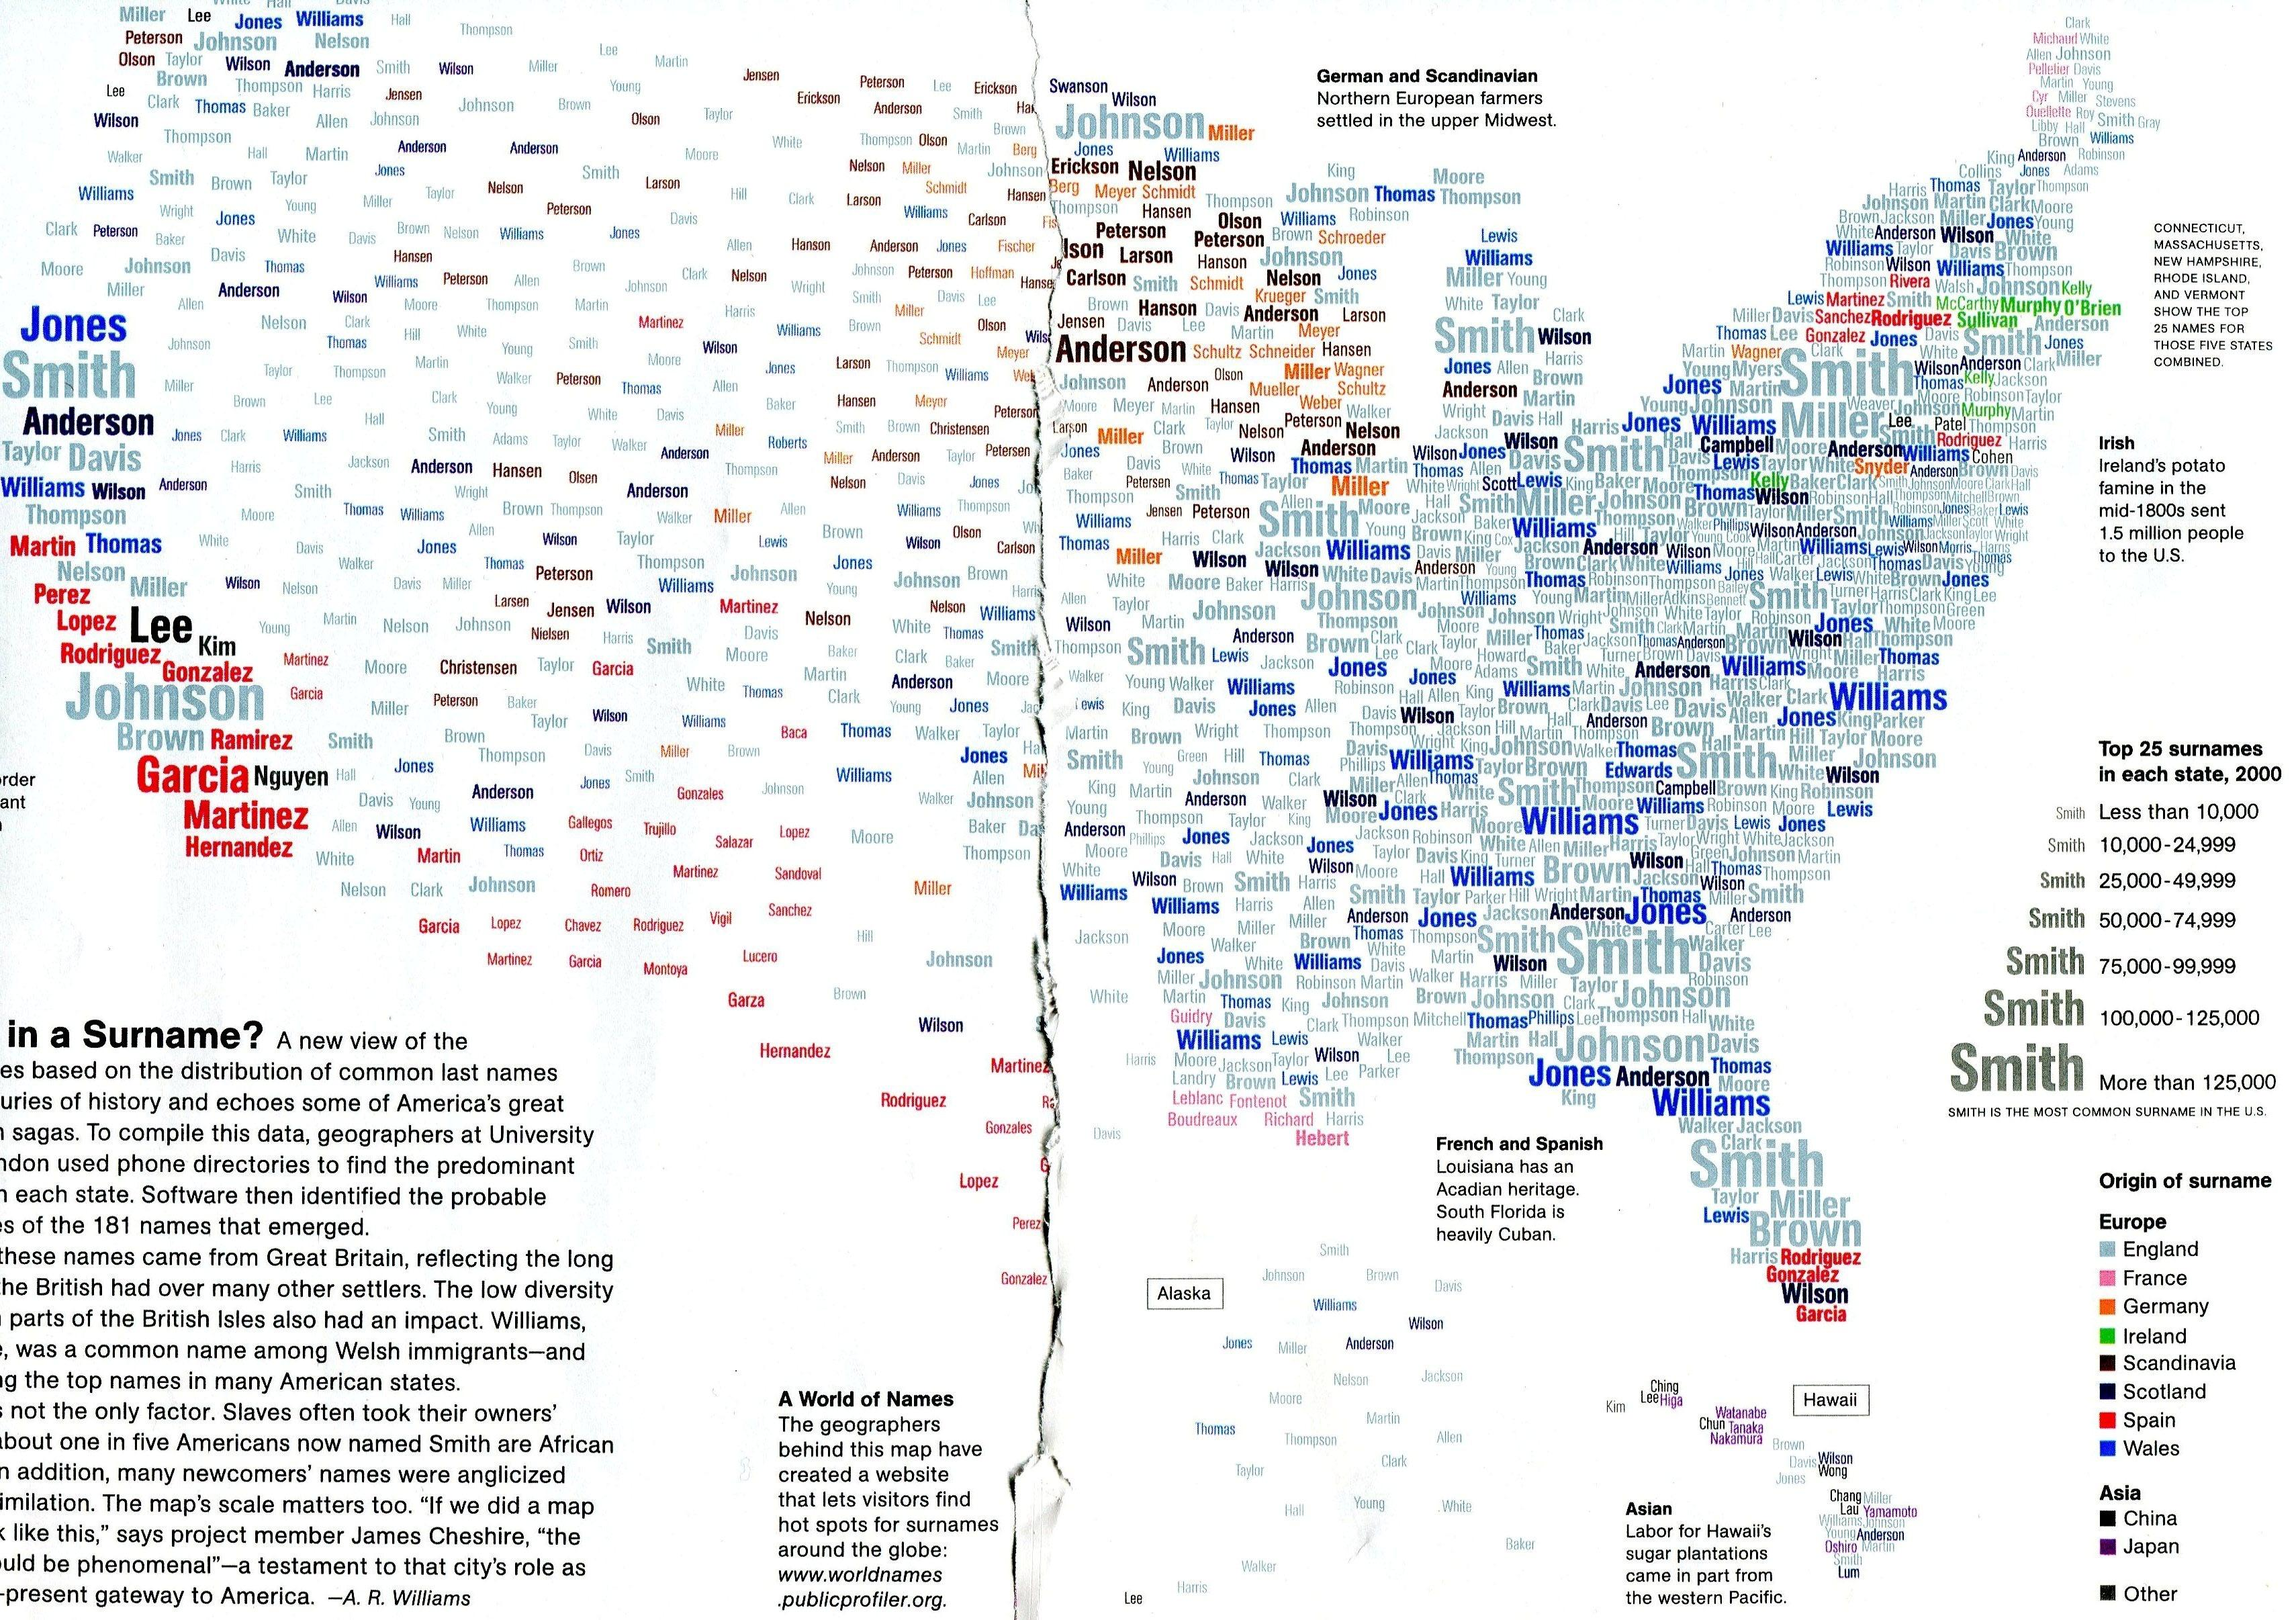
What a surname distribution map shows
A surname distribution map shows where people with particular last names live. Because surnames are passed down through families, the map ends up showing where different groups of settlers and immigrants made their homes, sometimes centuries ago. In the United States it picks out German and Scandinavian farming families in the upper Midwest, Irish families in New England, French Acadians in Louisiana and Maine, Spanish-speaking communities across the Southwest, and Japanese and Chinese families in Hawaii.
The map on this page was made by Mina Liu and Oliver Uberti for National Geographic magazine in February 2011, using research by geographers at University College London (UCL) [1][2]. It fills each state with its 25 most common surnames from 2000 phone directories, sizes each name by how many people have it, and colours it by its probable country of origin. Across the 50 states, those top 25 lists add up to 181 different names [2].
The most common surnames in the US
Smith is the most common surname in the US, held by 2,442,977 people in the 2010 Census [3]. These are the ten most common, with the share of each name held by people of different backgrounds, from the Census Bureau’s 2010 surname tables [3][4].
| Rank | Surname | People (2010 Census) | Main groups with the name |
|---|---|---|---|
| 1 | Smith | 2,442,977 | White 71%, Black 23% |
| 2 | Johnson | 1,932,812 | White 59%, Black 35% |
| 3 | Williams | 1,625,252 | Black 48%, White 46% |
| 4 | Brown | 1,437,026 | White 58%, Black 36% |
| 5 | Jones | 1,425,470 | White 55%, Black 38% |
| 6 | Garcia | 1,166,120 | Hispanic 92% |
| 7 | Miller | 1,161,437 | White 84% |
| 8 | Davis | 1,116,357 | White 62%, Black 32% |
| 9 | Rodriguez | 1,094,924 | Hispanic 94% |
| 10 | Martinez | 1,060,159 | Hispanic 93% |
Source: US Census Bureau, Frequently Occurring Surnames from the 2010 Census, top 1,000 surnames file [3][4]. White and Black mean non-Hispanic white alone and non-Hispanic Black alone.
The Census Bureau lists 162,253 surnames held by 100 or more people [3]. Names are spread very unevenly: about 1% of Americans are called Smith, and just 1,712 surnames cover half of the population [5].
Where American surnames come from
Most of the common surnames in the US came from Great Britain, because British settlers arrived early and in large numbers. As the article that goes with the National Geographic map points out, the small number of surnames in parts of the British Isles also had an effect: Williams was a common name among Welsh immigrants and is now among the top names in many states [1]. Smith, Johnson, Brown, Jones and Davis, the names that dominate the South and East, are English or Welsh in origin [1].
Ancestry is not the whole story. Enslaved people were often given or took their owners’ surnames, so many of the most common British names are now shared by large numbers of Black Americans [1]. In the 2010 Census, 23% of people named Smith and 48% of people named Williams were Black [4]. That makes Williams the most common surname among Black Americans, with about 775,000 people (our arithmetic from the Census file) [4][5]. Many immigrants’ names were also anglicised as families settled, which hides their origins [1][5].
Most surnames began as a description of the first person to hold them: their job (Smith, Miller), their father’s name (Johnson, Williams, Rodriguez), the place they came from, or a nickname [5]. In England, family names are generally dated to the Domesday Book of 1086, after the Norman Conquest [5].
Regional surname patterns across the US
The map shows clear regional clusters, each linked to a period of settlement [1]:
- Upper Midwest. Scandinavian names such as Johnson, Anderson, Nelson, Olson, Peterson and Larson, and German names such as Miller, Schmidt, Schultz and Mueller, from the northern European farmers who settled there. In the 2010 Census, 95% of people named Olson were white [4].
- New England. Irish names such as Murphy, Sullivan, O’Brien and Kelly, from the large Irish emigration that followed the potato famine of the mid-1800s.
- Louisiana and northern Maine. French names. In Louisiana these are Acadian (Cajun) names such as Landry, Guidry, Hebert and Boudreaux; in Maine, French Canadian names such as Pelletier, Ouellette and Cyr.
- The Southwest, Texas, California and South Florida. Spanish names such as Garcia, Martinez, Hernandez and Rodriguez, and, in South Florida, names from its large Cuban community.
- Hawaii. Japanese and Chinese names such as Tanaka, Nakamura, Higa, Wong and Lee, partly from workers who came from Asia to Hawaii’s sugar plantations.
The map has limits. It uses 2000 phone directories, which leave out anyone without a listed number, and showing only the top 25 names per state hides smaller communities. One of the UCL geographers behind it, James Cheshire, said that a map of New York City alone would show “phenomenal” diversity [1].
How American surnames are changing
Hispanic and Asian surnames have become far more common since the map’s 2000 data. Garcia, Rodriguez and Martinez are now in the top ten, and Hernandez is 11th [3][4]. The number of people named Garcia rose from 858,289 in the 2000 Census to 1,166,120 in 2010 [5]. Nguyen, the most common Vietnamese surname, rose from 310,125 people to 437,645 and ranked 38th in 2010; Lee ranked 21st, Kim 77th and Patel 95th [4][5].
So a surname map drawn from today’s data would show more Spanish names across the South and West, and more Asian names in California, Texas, New York and New Jersey, than the 2000 map does.
How to map where your surname is common
If you want to see where your own surname is concentrated, there are a few places to start:
- Forebears covers about 31 million surnames worldwide, with their meanings and the countries where each is most common [6].
- The US Census Bureau publishes counts for every surname held by 100 or more people in 2000 and 2010, with a breakdown by race and Hispanic origin, though not by state [3].
- Genealogy sites such as Ancestry and FamilySearch let you map where people with a surname lived in historical census records, which is useful for tracing a family’s movements.
The UCL WorldNames website mentioned on the National Geographic map is no longer online.
Questions about surname distribution maps
What is the most common last name in the US?
Smith, with 2,442,977 people in the 2010 Census, followed by Johnson, Williams, Brown and Jones [3].
How many last names are there in the US?
The Census Bureau counted 162,253 surnames held by 100 or more people in 2010 [3]. Rarer names are not included in that figure.
Where are Scandinavian surnames most common in the US?
In the upper Midwest, especially Minnesota, Wisconsin and the Dakotas, where Scandinavian names such as Johnson, Anderson, Nelson and Olson are among the most common, reflecting the northern European farmers who settled there [1].
Why is Williams so common among Black Americans?
Many enslaved people took or were given their owners’ surnames, many of which were British names such as Williams [1]. In 2010, 48% of Americans named Williams were Black [4].
How can I find where my surname comes from?
Start with a surname dictionary or a site such as Forebears, which shows where a name is most common today, then use historical census records on genealogy sites to trace where your own family lived [6].
Sources
- A. R. Williams, What’s in a Surname?, National Geographic, February 2011, text accompanying the map on this page.
- FlowingData, Map: United States of surnames, 27 January 2011 (credits the map to Mina Liu and Oliver Uberti for National Geographic).
- US Census Bureau, Frequently Occurring Surnames from the 2010 Census.
- US Census Bureau, 2010 Census top 1,000 surnames file.
- Wikipedia, Surname, and List of most common surnames in North America (2000 and 2010 Census counts).
- Forebears, surname meanings and distribution.
Last reviewed 3 November 2026