The tax to GDP ratio is a country’s total tax revenue as a share of the size of its economy. Across the 38 OECD countries it averaged 34.1% in 2024, the highest level on record, according to OECD Revenue Statistics 2025. Denmark had the highest ratio at 45.2% and Mexico the lowest at 18.3%. The United States collected 25.6% of GDP in tax, well below the OECD average.
What is the tax to GDP ratio?
The tax to GDP ratio divides everything a government collects in tax in a year by the country’s gross domestic product for the same year. It is the standard way to compare how much tax countries raise, because it removes the effect of the size of each economy.
In the OECD’s definition, taxes are compulsory payments to government that don’t buy you a specific service in return. The figures cover every level of government (national, state or regional and local) and include compulsory social security contributions, such as National Insurance in the UK or payroll taxes for Social Security in the US. That last point matters when you compare countries, because places that fund pensions and health care through social contributions show higher ratios than places where people pay into private schemes.
As a simple example, if a country collects 340 billion in taxes and its GDP is 1,000 billion, its tax to GDP ratio is 34%.
Tax to GDP ratio by country
European countries collect the most tax relative to their economies, and Latin American and Asian economies collect the least. The table shows the latest OECD figures for the larger OECD economies, from the OECD’s Revenue Statistics 2025 and its country notes.
| Country | Tax to GDP ratio, 2024 | Rank among 38 OECD countries |
|---|---|---|
| Denmark | 45.2% | 1st |
| France | 43.5% | 2nd |
| Austria | 43.4% | 3rd |
| Italy | 42.8% | 4th |
| Germany | 38.0% | 13th |
| Canada | 34.9% | 21st |
| United Kingdom | 34.4% | 22nd |
| Japan | 33.7% (2023) | 25th |
| Australia | 29.9% (2023) | 29th |
| United States | 25.6% | 31st |
| South Korea | 25.3% | 32nd |
| Türkiye | 24.0% | 34th |
| Mexico | 18.3% | 38th |
| OECD average | 34.1% |
Japan and Australia hadn’t reported 2024 data when the OECD published, so their 2023 figures are shown. The OECD average rose by 0.3 percentage points in 2024, the first rise since 2021, as several governments raised taxes to meet spending pressures.
Tax to GDP ratio in emerging economies
Most large emerging economies collect between about 12% and 33% of GDP in tax. Figures for countries outside the OECD come a year or two later, so the latest comparable numbers in the OECD’s Global Revenue Statistics Database are for 2022.
| Country | Tax to GDP ratio, 2022 |
|---|---|
| Brazil | 33.3% |
| Argentina | 29.6% |
| South Africa | 27.1% |
| China | 20.1% |
| Indonesia | 12.1% |
Brazil stands out, collecting a similar share of its economy in tax to the UK or Canada. Indonesia is at the other end, and Gulf oil producers such as Saudi Arabia are lower still, because oil income rather than tax pays for most government spending.
How tax to GDP ratios have changed since 2022
The Visual Capitalist infographic shows 19 major economies using 2022 data, and several of those figures have moved since. France was at 46% of GDP in 2022 and has fallen to 43.5%, slipping behind Denmark into second place. The US fell from 28% in 2022 to 25.6% in 2024.
Some 2022 figures have also been revised. The infographic gives South Korea 32%, which matched the OECD data at the time, but the OECD now puts Korea’s 2022 ratio at 29.7%, and it has since fallen to 25.3%. The UK’s 2022 figure is now 35.2% rather than the 34% shown, and Japan’s is 34.5% rather than 33%. Italy went the other way, rising from 8th place among OECD countries in 2023 to 4th in 2024.
Over a longer period, 31 of the 38 OECD countries collected a higher share of GDP in tax in 2024 than in 2010. Slovakia (up 7.7 points), Japan (up 7.5) and Greece (up 7.4) had the biggest increases. Ireland was 6.0 points lower. Its GDP is unusually inflated by the profits of multinational companies based there, which makes its ratio look low.
Why some countries collect more tax than others
The biggest difference is what the state pays for. Countries with high ratios, such as Denmark, France and Italy, fund generous public pensions, health care and unemployment support through taxes and social contributions. In the US and Australia more of that is paid privately, so it doesn’t show up as tax.
Other factors push ratios down. A large informal economy makes income and sales taxes harder to collect, which is part of the reason for Mexico’s and Indonesia’s low figures. Countries with large state oil revenues, such as Saudi Arabia, have less need to tax. And the mix of taxes matters, as the OECD’s 2023 data shows the average OECD country raised 25.5% of its tax from social security contributions, 23.7% from personal income tax, 20.5% from VAT and 11.9% from corporate income tax.
A higher ratio isn’t automatically better or worse. It tells you how much of the economy passes through government, not whether the money is spent well.
The US tax to GDP ratio
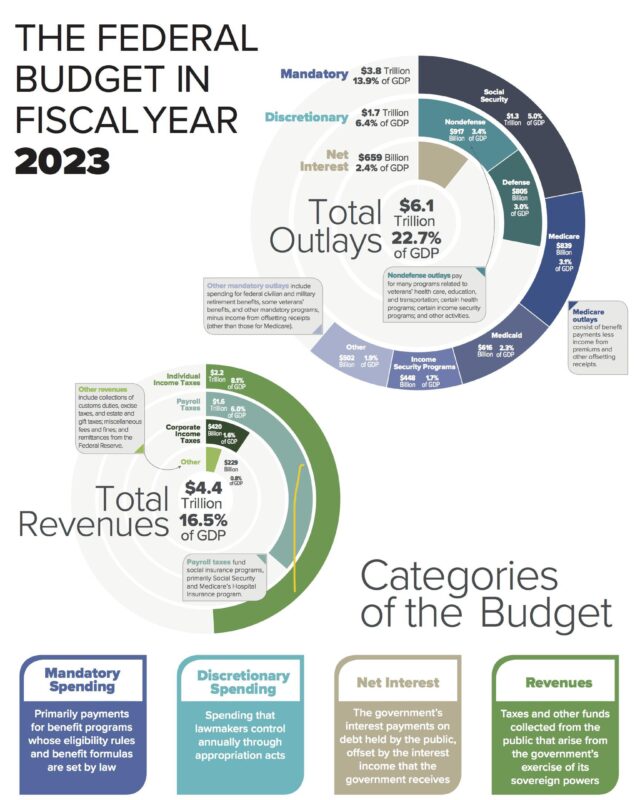
The US tax to GDP ratio was 25.6% in 2024, unchanged from 2023, according to the OECD country note for the United States. That ranked it 31st of the 38 OECD countries, up from 32nd in 2023. Since 2000 the US ratio has ranged from a high of 28.3% (in 2000) to a low of 22.9% in 2009, during the financial crisis.
The US relies more on income taxes and less on consumption taxes than most OECD countries. It has no national VAT, which is a large source of revenue in Europe, and sales taxes are set by states and local governments.
What is a good tax to GDP ratio?
There is no single right level. It depends on what a country wants its government to provide. For developing countries, the World Bank has described tax revenue above about 15% of GDP as a minimum needed to support growth and reduce poverty, as Investopedia’s guide to the ratio explains. Among rich countries, the OECD average of 34.1% is the usual benchmark.
Questions about the tax to GDP ratio
What does the tax to GDP ratio measure?
It measures how much of a country’s economic output its government collects in tax in a year. It is total tax revenue, including social security contributions and taxes at every level of government, divided by GDP.
Which country has the highest tax to GDP ratio?
Denmark, at 45.2% in 2024, according to the OECD. It was also first in 2023. France was second at 43.5%, then Austria at 43.4% and Italy at 42.8%.
Which country has the lowest tax to GDP ratio?
Among OECD countries, Mexico has the lowest ratio, at 18.3% in 2024. Worldwide, some oil exporters and low-income countries collect far less, with Indonesia at about 12% of GDP in 2022.
Do taxes add to GDP?
Not as a separate item. GDP measures the value of what an economy produces, and taxes are a transfer of part of that income to government. GDP at market prices does include taxes on products such as VAT and excise duties, because they are part of the price you pay, but income taxes are not added on top.
What is the UK’s tax to GDP ratio?
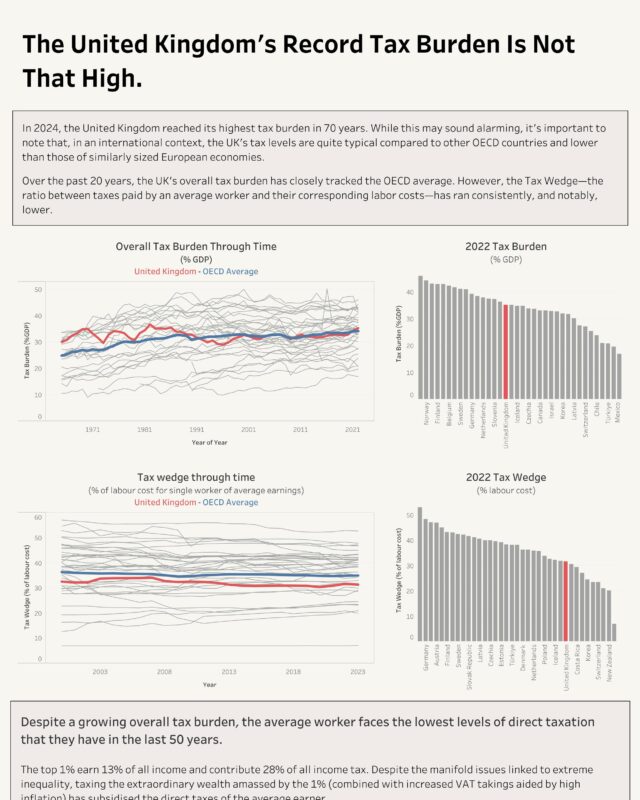
The UK’s ratio was 34.4% in 2024, just above the OECD average, down from 35.0% in 2023, according to the OECD. Our page on the UK tax burden over time looks at how it has changed and how it compares with other countries.
Sources
- OECD, Revenue Statistics 2025 (9 December 2025), with the country notes for Denmark, France, Italy, Germany, Canada, the United Kingdom, Japan, Australia, Korea, Türkiye and Mexico.
- OECD, Revenue Statistics 2025, the United States.
- OECD, Global Revenue Statistics Database (2022 figures for Brazil, Argentina, South Africa, China and Indonesia).
- Investopedia, Tax-to-GDP ratio.
- Visual Capitalist on Voronoi, Taxes Collected Relative to GDP Size in Every Major Economy (2 August 2024), the original post for this infographic.