China crude oil imports averaged 11.1 million barrels a day in 2024, close to eight times the 1.4 million it bought in 2000, and hit a record 11.6 million barrels a day in 2025. Russia is the largest supplier, sending 2.19 million barrels a day in 2024, ahead of Saudi Arabia, Malaysia and Iraq. In 2026 imports fell sharply after the disruption in the Strait of Hormuz.
This page covers how much crude China imports, how that has changed since 2000 and which suppliers grew. For a country by country breakdown of 2024 with every smaller supplier and the sea and pipeline routes, see our page on China oil imports by country.
How much crude oil does China import?
China is the world’s largest crude importer. Its imports by year, from China’s customs data as reported by Econovis, the U.S. Energy Information Administration (EIA) and Reuters, were:
| Period | Crude imports, million barrels a day | What happened |
|---|---|---|
| 2000 | 1.4 | Start of two decades of fast growth [1] |
| 2017 | 8.4 | China passed the United States as the largest crude importer [3] |
| 2020 | 10.9 | End of the fast growth years [2] |
| 2023 | 11.3 | Previous record [2] |
| 2024 | 11.1 | Down 1.9% on 2023 [2] |
| 2025 | 11.6 | Record year, driven by stockpiling [4][5] |
| Second half of 2025 | 12.0 | Buying while prices were the lowest since 2020 [5] |
| Second quarter of 2026 | 8.1 | Down 32% on the first quarter after the Hormuz disruption [5] |
| October 2026 | 9.88 | Highest month since March 2026 [6] |
In a year, 11.1 million barrels a day comes to about 4,057 million barrels, the 2024 total in China’s customs data [7]. In 2023 China spent $337 billion on imported crude, its single largest import bill among fuels [7].
China crude oil imports trend since 2000
The trend has two clear phases. From 2002 to 2020 imports grew by 11.2% a year, from 1.4 to 10.9 million barrels a day. From 2020 to 2024 growth slowed to 0.5% a year [2]. Over the whole period from 2000 to 2024 the compound growth rate was 9.0% a year [1].
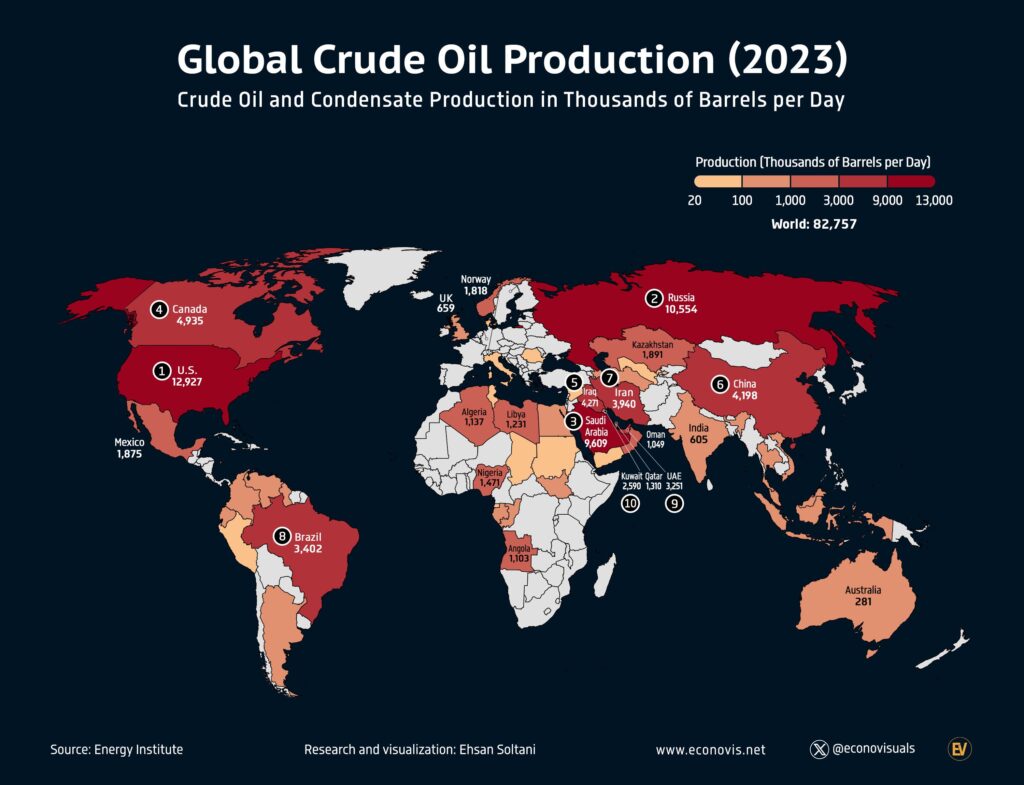
The fast years were driven by new refineries, strategic stockpiling and falling domestic output, according to the EIA [3]. China still produces a good deal of its own oil, about 4.1 million barrels a day in 2022, the fifth largest output in the world, but imports cover over 70% of what it uses [4][7].
The slowdown since 2020 reflects weaker growth in fuel demand. 2025 broke the pattern only because China filled its reserves. The Center on Global Energy Policy at Columbia University (CGEP), citing Rystad Energy, says China added 430,000 barrels a day to storage in 2025, 83% of the increase in imports that year [4]. By early January 2026 China held about 1.2 billion barrels of oil onshore, enough for 104 days of net crude imports at the 2025 rate [4].
China’s top oil suppliers, 2000 and 2024
The supplier list has changed almost completely in 24 years. In 2000 Oman, Angola and Iran were the biggest named sources. By 2024 Russia, Saudi Arabia, Malaysia and Iraq together supplied 57.5% of China’s crude [1][8].
| Supplier | 2000, thousand barrels a day | 2024, thousand barrels a day | Growth, 2010 to 2024, per year |
|---|---|---|---|
| Russia | 30 | 2,194 | 15.1% |
| Saudi Arabia | 115 | 1,552 | 4.0% |
| Malaysia | 15 | 1,387 | not given |
| Iraq | 64 | 1,237 | 12.9% |
| Oman | 314 | 823 | 7.0% |
| UAE | 9 | 720 | 14.7% |
| Brazil | 5 | 715 | 11.2% |
| Angola | 173 | 561 | minus 2.4% |
| Iran | 140 | none recorded | not given |
| All other countries | 544 | 1,898 | not given |
| Total | about 1,400 | about 11,100 | 6.2% |
Source, Econovis using China customs data [1]. Total imports grew by 6.2% a year from 2010 to 2024, so Russia, the UAE, Iraq, Brazil and Oman all grew faster than the market, while Saudi Arabia grew more slowly and Angola shrank [1].
Russia, China’s largest oil supplier
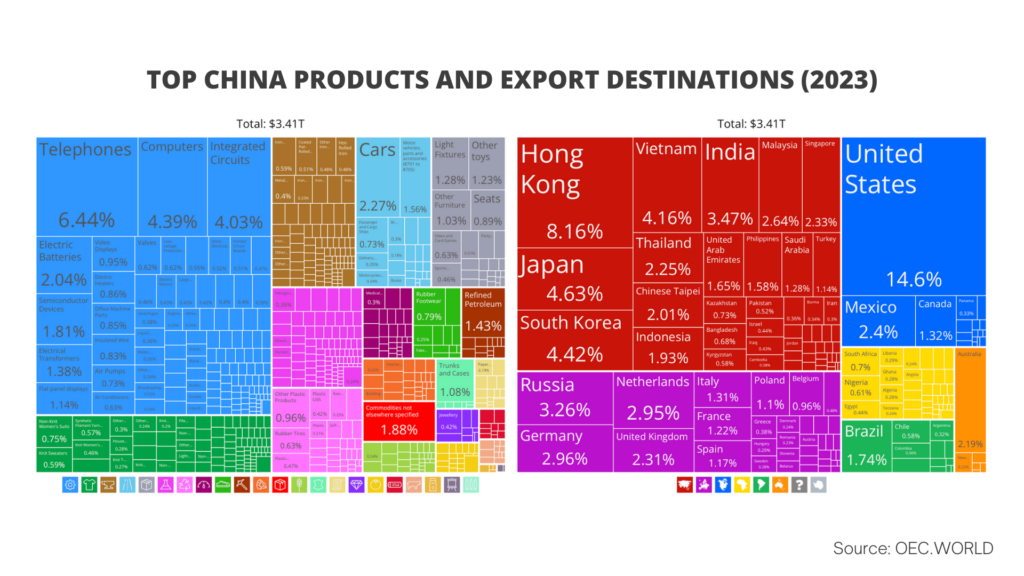
Russia sent 2.19 million barrels a day in 2024, 41% more than Saudi Arabia’s 1.55 million [8]. It had already passed Saudi Arabia in 2023, when it supplied 2.15 million against 1.73 million [7]. Sanctions after the invasion of Ukraine cut Russia’s EU market, where crude imports from Russia fell from 3.4 million barrels a day in 2021 to around half a million in 2023, and China picked up discounted barrels. In 2023 China paid an average of $76 a barrel for Russian crude against $86 for Gulf crude [7].
Russia’s lead narrowed in 2025. New US sanctions on Rosneft and Lukoil led China’s state refiners to buy less, and Russian supply fell by 150,000 barrels a day (6.9%), though it stayed first with 18% of China’s imports [4].
Iran, Malaysia and the oil that is not on paper
Iran was a major supplier in 2000 with 140,000 barrels a day, but China’s customs have recorded no Iranian crude since 2022 [1][4]. Over the same years Malaysia grew from 15,000 to 1.39 million barrels a day, far more than it produces [1][4]. Econovis and CGEP both conclude that much of the “Malaysian” oil is Iranian crude moved between ships off Malaysia and relabelled to get round sanctions [1][4].
Kpler tanker tracking put China’s real imports from Iran at 1.38 million barrels a day in 2025, plus 389,000 from Venezuela. With Russian volumes from sanctioned companies, CGEP estimates at least 2.6 million barrels a day of China’s 2025 imports, over 22%, came from sanctioned sources [4].
China crude oil imports in 2025 and 2026
2025 set a record of 11.6 million barrels a day, up from 11.1 million in 2024 [4]. Russia, Saudi Arabia, Malaysia, Iraq and Brazil supplied 62% [4]. Most of the growth came from Brazil, up 28%, and from Indonesia, whose recorded supply jumped from under 3,000 to 291,000 barrels a day, which CGEP attributes mainly to relabelled Iranian oil [4]. Imports of US crude fell by 76% as trade tensions grew, and Canada took their place [4].
2026 has gone the other way. After flows through the Strait of Hormuz were disrupted, China imported 8.1 million barrels a day in the second quarter, and in May and June imports fell below 8 million for the first time since 2016 [5]. The biggest falls in seaborne cargoes were from Iraq, Russia and the UAE, and refineries ran down stocks rather than cut output to the same extent [5]. Imports recovered to 41.94 million tonnes in October, about 9.88 million barrels a day, still well below the 2025 pace [6].
For context on who holds the world’s oil, see our page on the largest oil reserves by country.
Questions about China crude oil imports
How much crude oil does China import per day?
China imported 11.6 million barrels a day in 2025, a record, and 11.1 million in 2024 [4]. In 2026 the rate has been lower, 8.1 million in the second quarter and 9.88 million in October [5][6].
Who are China’s top oil suppliers?
Russia, Saudi Arabia, Malaysia, Iraq and Brazil, which together supplied 62% of China’s crude imports in 2025 [4]. In 2024 the order was Russia, Saudi Arabia, Malaysia, Iraq, Oman, the UAE, Brazil and Angola [1].
Is China the world’s largest oil importer?
Yes. China passed the United States in 2017, importing 8.4 million barrels a day against 7.9 million [3]. Econovis puts China’s share of world crude imports at 23% [7].
Why did China’s oil imports fall in 2026?
Disrupted traffic through the Strait of Hormuz pushed oil prices up, and China cut purchases and drew on the stocks it built in 2025. Second quarter imports were 32% below the first quarter [5].
How much oil does China import from Russia?
About 2.19 million barrels a day in 2024, 19.8% of the total, and about 2.04 million in 2025 after a 150,000 barrel a day fall (our arithmetic from CGEP’s figures) [4][8].
Sources
- Econovis, China’s Top Crude Oil Suppliers, A Two-Decade Transformation (2000 to 2024), using China customs data.
- Econovis, China’s Crude Oil Imports Reach 11.1 Mb/D in 2024, Down 1.9% from 2023.
- U.S. Energy Information Administration, China surpassed the United States as the world’s largest crude oil importer in 2017, 5 February 2018.
- Erica Downs, Center on Global Energy Policy, Columbia University, Where China Gets Its Oil, Crude Imports in 2025, 29 January 2026.
- U.S. Energy Information Administration, China’s crude oil imports fell in the second quarter, 31 July 2026.
- Reuters, China’s October crude oil imports rise to highest level since March, 10 November 2026.
- Econovis, China’s Top Crude Oil Suppliers (2000 to 2024).
- Econovis, Russia Becomes China’s Top Crude Oil Supplier in 2024 with 2.19 Mb/D.