Which S&P 500 stocks have performed best?
NVIDIA has been the best performing S&P 500 stock over the past 5, 10, 15 and 20 years. To 30 November 2024 its total return was +2,462% over five years and +92,790% over twenty, so $1,000 invested in late 2004 would have grown to about $929,000. Texas Pacific Land, Netflix, Axon and Broadcom also appear among the top performers.
The infographic by Visual Capitalist ranks the top eight S&P 500 stocks by total return for each of the four periods, using YCharts data compiled by Charlie Bilello [1]. Total return counts share price gains plus dividends. The figures run to 30 November 2024, so they are a snapshot, but the long-run winners change slowly and the patterns behind them are worth understanding.
Top performing S&P 500 stocks by period
The table gives the top five for each period from the Visual Capitalist ranking, with total returns to 30 November 2024 [1].
| Rank | 5 years | 10 years | 15 years | 20 years |
|---|---|---|---|---|
| 1 | NVIDIA +2,462% | NVIDIA +27,360% | NVIDIA +47,035% | NVIDIA +92,790% |
| 2 | Tesla +1,469% | AMD +4,817% | Texas Pacific Land +19,952% | Netflix +54,258% |
| 3 | Supermicro +1,432% | Texas Pacific Land +3,558% | Axon +15,051% | Texas Pacific Land +30,461% |
| 4 | Axon +777% | FICO +3,216% | Broadcom +14,039% | Apple +22,923% |
| 5 | Quanta Services +738% | Builders FirstSource +2,927% | FICO +12,800% | Booking Holdings +21,694% |
The rest of the top eight are Arista Networks, Texas Pacific Land and Builders FirstSource over five years, Axon, Broadcom and Arista over ten, Netflix, United Rentals and Domino’s Pizza over fifteen, and Monster Beverage, Intuitive Surgical and Amazon over twenty [1].
NVIDIA, the best performing stock in the S&P 500
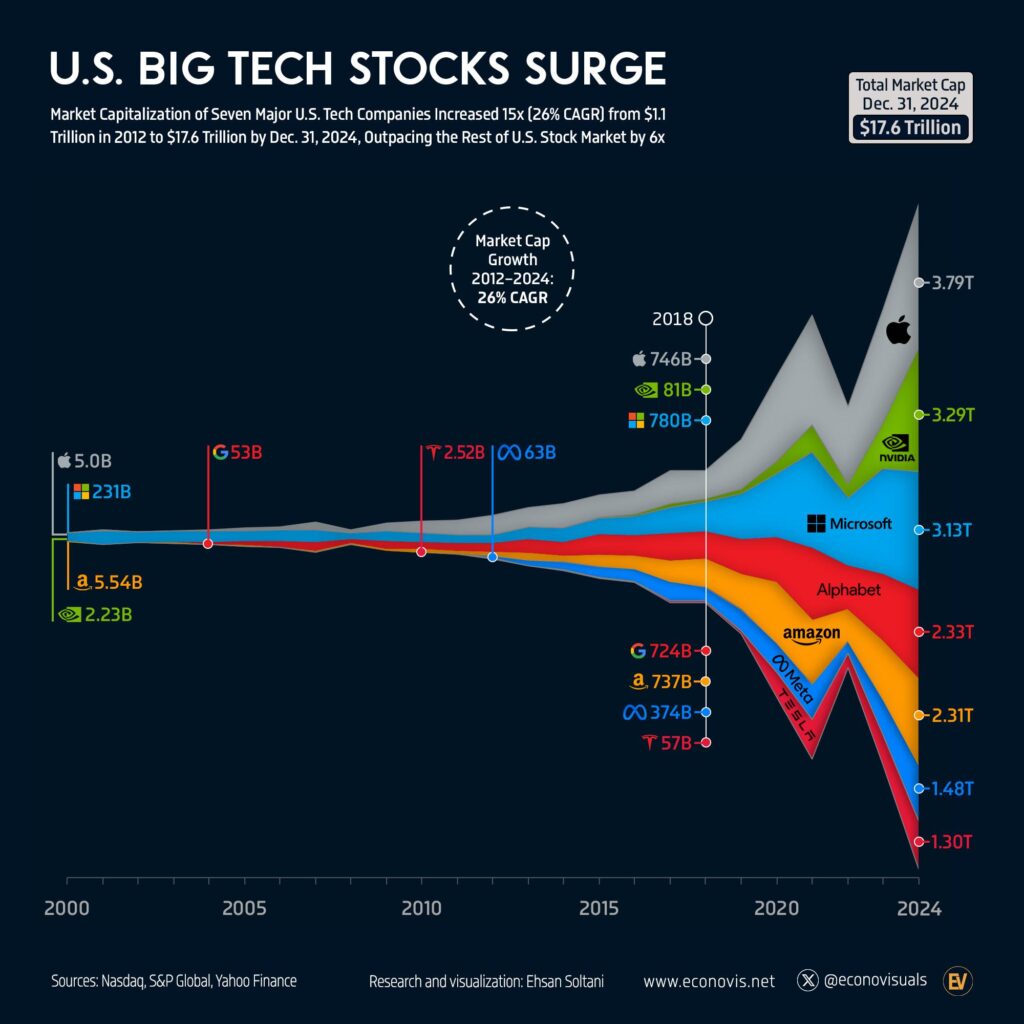
NVIDIA tops every period by a wide margin. Its ten-year return of +27,360% is more than five times the next best, AMD at +4,817% [1]. The company started out making graphics chips for gaming, and the same kind of chip turned out to suit the heavy parallel maths used to train and run artificial intelligence models. Demand from data centres for AI work is what drove the steepest part of the rise.
NVIDIA joined the S&P 500 in November 2001, so it was an index member for the whole of all four periods [4]. That isn’t true of every name on the list, as covered below.
The surprising names on the list
Not all of the long-run winners are technology companies. Texas Pacific Land appears in all four periods, with +30,461% over twenty years [1]. It owns a large area of land in West Texas and earns royalties and fees from oil and gas production in the Permian Basin, which grew very quickly after the shale boom. Domino’s Pizza returned +7,271% over fifteen years and United Rentals +9,544%, which Visual Capitalist calls out as two of the less expected names [1]. Monster Beverage, the energy drink maker, returned +15,439% over twenty years.
What they have in common is many years of steady growth in profits, compounded. A business that grows earnings at 20% a year for two decades multiplies them about 38 times (our arithmetic), and share prices tend to follow earnings over long periods.
Top performers against the S&P 500 index
Every stock in the ranking beat the index by a huge margin, which is expected for a list of the top eight out of 500. The more useful comparison is with the index itself, because most investors own it through a fund rather than picking single stocks.
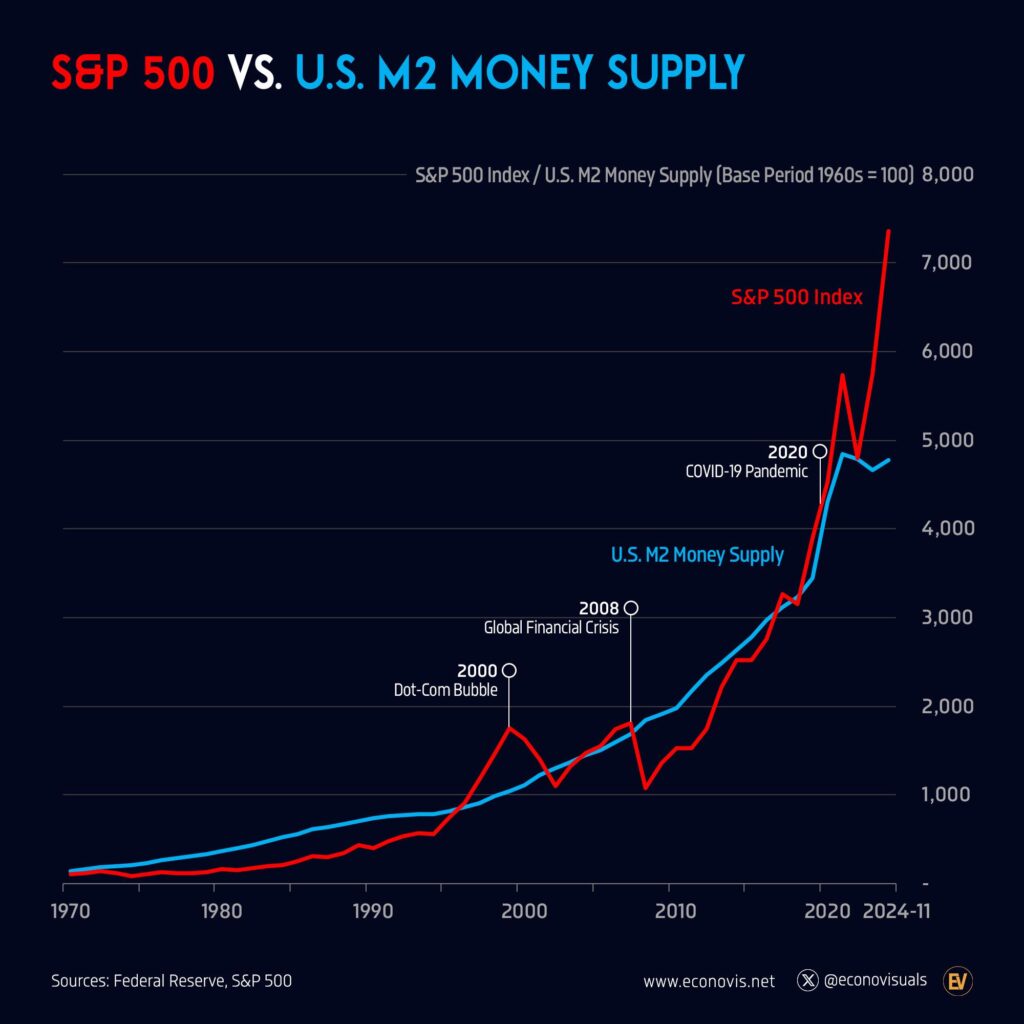
The graphic gives the S&P 500 as +87% over five years, +194% over ten, +443% over fifteen and +399% over twenty. Those look like price returns without dividends, even though the chart is labelled total return. Using the annual returns published for the index, its price rose about 385% over the 20 calendar years 2005 to 2024, while the total return with dividends reinvested was about 617% (our arithmetic from the yearly figures) [2]. The ten-year comparison is similar, at about 186% on price against 243% with dividends. So the index did better than the graphic suggests, although still nowhere near the top stocks.
The 15-year figure for the index is higher than the 20-year one because the 15-year window starts in late 2009, close to the low point after the financial crisis, while the 20-year window includes the 2008 crash [2].
Survivorship and index membership
A list of the best performing S&P 500 stocks is a list of today’s members looking back. Many of these companies were small when their run began and only joined the index after most of the gains were made. Texas Pacific Land joined the S&P 500 on 26 November 2024, days before the data was taken, Supermicro in March 2024, Axon in May 2023 and FICO in March 2023 [4]. Someone who only bought S&P 500 members would not have owned them for most of their rise.
Membership also changes. Builders FirstSource, ranked in both the five and ten-year lists, was removed from the S&P 500 on 21 September 2026 in a reshuffle based on market value, with Illumina taking its place [5]. Supermicro, third over five years, had a very volatile 2024. Its shares fell 33% in a day when its auditor, Ernst & Young, resigned in October that year [6]. Past returns of this size are rare and are not a guide to what a stock will do next.
What the S&P 500 is
The S&P 500 is an index of 500 large US companies chosen by a committee at S&P Dow Jones Indices. It took its current form on 4 March 1957 [2]. It is weighted by market value, so the biggest companies carry the most weight, and it covers about 83% of the total market value of US listed companies [2]. Since 1926 the index has returned about 9.8% a year including dividends, or about 6% after inflation [2].
Questions about S&P 500 stocks and returns
What is the best performing S&P 500 stock of the last 20 years?
NVIDIA, with a total return of +92,790% over the 20 years to 30 November 2024. Netflix was second at +54,258% [1].
What is the best performing S&P 500 stock of the last 10 years?
Also NVIDIA, at +27,360%, followed by AMD at +4,817% and Texas Pacific Land at +3,558% [1].
What would $10,000 in the S&P 500 20 years ago be worth now?
With dividends reinvested, $10,000 at the start of 2006 would have been worth about $80,600 at the end of 2025, before fees and taxes. That works out at about 11.0% a year (our arithmetic from the annual returns) [2].
What is the average annual return of the S&P 500?
About 9.8% a year including dividends since 1926. Over the ten years to the end of 2025 it was higher, at 14.8% a year [2].
Is Apple one of the best performing S&P 500 stocks?
Over 20 years, yes. Apple was fourth with a total return of +22,923% to November 2024, but it does not make the top eight over 5, 10 or 15 years [1].
Sources
- Visual Capitalist, The Best Performing S&P 500 Stocks Over Time, Voronoi, 7 December 2024. The creator’s post with this graphic, YCharts data via Bilello Blog.
- Wikipedia, S&P 500, history and table of annual price and total returns.
- Bilello Blog, Charlie Bilello, the compiler of the stock return data.
- Wikipedia, List of S&P 500 companies, dates added to the index.
- Wikipedia, Historical components of the S&P 500.
- Wikipedia, Supermicro, citing CNBC, 30 October 2024.
Last reviewed 10 November 2026