Key figures from the treemaps
- US exports totalled $2.02 trillion in 2023, the figure shown above both treemaps.
- The largest single products are crude petroleum (5.8%), aircraft parts (5.61%) and refined petroleum (5.59%). With petroleum gas (3.35%), oil and gas products make up 14.74% of the total (our sum).
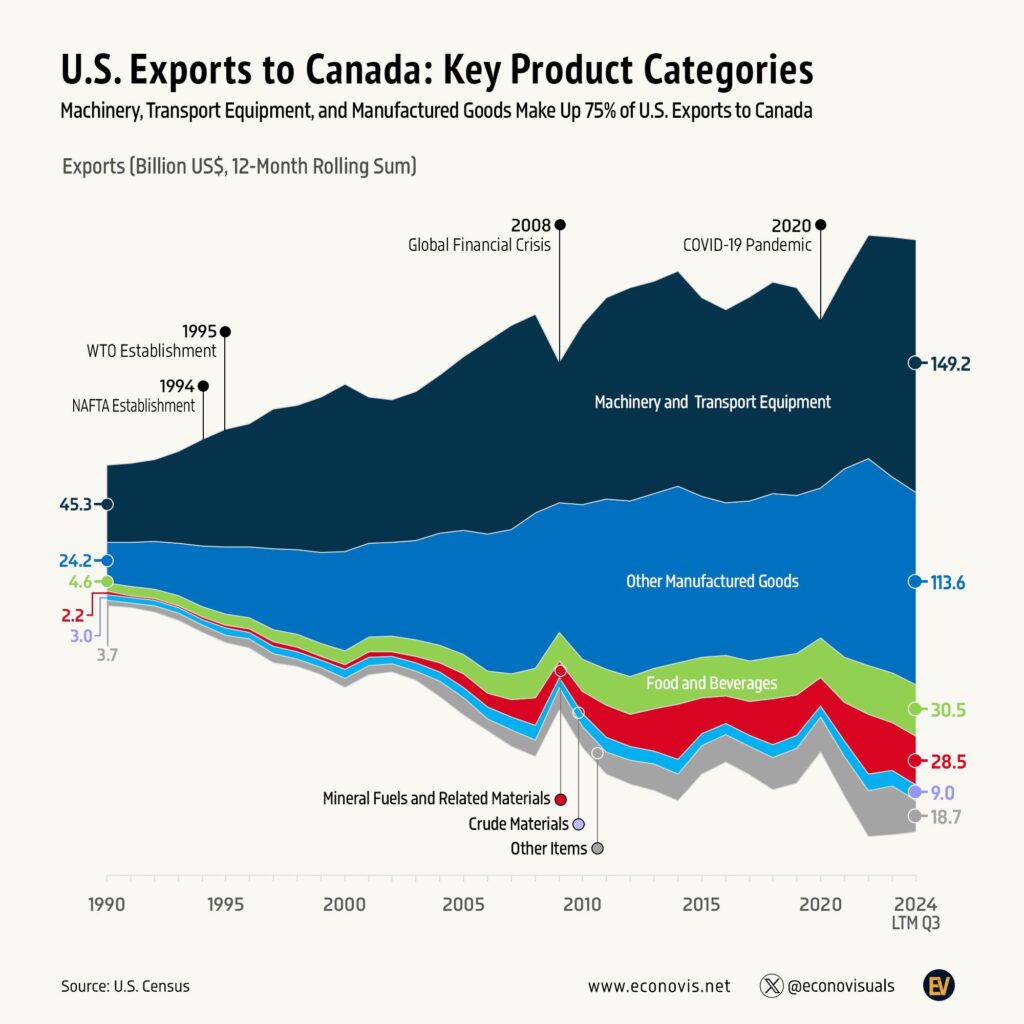
- Canada (17.5%) and Mexico (16%) take a third of US exports between them. China is third at 7.32%.
- Europe’s largest buyers are the Netherlands (4.07%), Germany (3.8%) and the United Kingdom (3.67%).
- All figures are from the graphic, which cites OEC.WORLD.
Top US exports by product in 2023
Left treemap, headed “Total: $2.02T”. Each tile’s area is its share of US exports. Tiles are coloured by product group and a row of category icons sits under the chart without text labels, so the group names below are ours, matched by colour. Labels shortened on the graphic are marked as truncated.
| Product group (by colour) | Products and share of US exports |
|---|---|
| Mineral products | Crude Petroleum 5.8%, Refined Petroleum 5.59%, Petroleum Gas 3.35%, Coal Briquettes 0.76%, one unlabelled tile 0.3% |
| Transportation | Aircraft Parts 5.61%, Cars 3.12%, Motor vehicles; parts and accessories (8701 to 8705) 2.35%, Delivery Trucks 1.13%, Aircraft (truncated) 0.34%, Planes (truncated, no value shown) |
| Machinery | Integrated Circuits 2.16%, Telephones 1.85%, Computers 1.51%, Machines and apparatus of a kind used solely or (truncated) 0.99%, Office Machine Parts 0.7%, Valves 0.67%, Centrifuges 0.64%, Insulated Wire 0.62%, Low-voltage Protection (truncated) 0.62%, Gas Turbines 0.56%, Liquid Pumps 0.46%, Transmissions 0.42%, Electrical (truncated) 0.4%, Semiconductor (truncated) 0.39%, Machinery (truncated) 0.38%, Spark-ignition (truncated) 0.38%, Air Pumps 0.38%, Blank Audio (truncated) 0.35%, Large (truncated) 0.29%, Electric (truncated) 0.24%, plus several small or unlabelled tiles |
| Chemical products | Vaccines, blood, antisera, toxins and cultures 2.47%, Packaged Medicaments 1.71%, Laboratory Reagents 0.51%, Acyclic (truncated) 0.38%, Prepr binder (truncated) 0.32%, Hormones 0.31%, Beauty (truncated) 0.31%, plus small unlabelled tiles |
| Instruments | Medical Instruments 1.81%, Orthopedic Appliances 0.65%, Chemical Analysis (truncated) 0.54%, Other (truncated) 0.36%, X-Ray (truncated) 0.29%, Gas and (truncated) 0.21% |
| Unspecified | Commodities not elsewhere specified 3.34% |
| Vegetable products | Soybeans 1.39%, Corn 0.68%, Other Nuts 0.4%, Wheat 0.3%, Rice (no value shown) |
| Precious metals | Gold 1.29%, Diamonds 0.83%, Jewellery 0.6%, plus unlabelled tiles |
| Plastics and rubbers | Ethylene Polymers 0.79%, Plastic Lids 0.34%, Raw (truncated) |
| Metals | Scrap Iron 0.33%, Other Iron (truncated) 0.3%, Iron (truncated) 0.27%, Metal (truncated) 0.27%, Scrap (truncated) 0.19%, Metal (truncated) 0.17% |
| Food, animal, paper, textiles and others | Other Edible (truncated) 0.32%, Pig Meat 0.3%, Sulfate (truncated) 0.26%, Raw (truncated) 0.3%, Textile (truncated) 0.28%, Paintings 0.42%, plus small tiles for poultry, bovine meat, kraft paper and seats |
Top US export destinations in 2023
Right treemap, also headed “Total: $2.02T”, coloured by continent. Footer: Source: OEC.WORLD.
| Continent (by colour) | Destinations and share of US exports |
|---|---|
| North America | Canada 17.5%, Mexico 16%, Dominican Republic 0.65%, Panama 0.56%, plus small tiles |
| Asia | China 7.32%, Japan 3.77%, South Korea 3.21%, Singapore 2.1%, India 1.99%, Chinese Taipei 1.97%, Hong Kong 1.38%, United Arab Emirates 1.23%, Malaysia 0.96%, Thailand 0.78%, Turkey 0.73%, Israel 0.7%, Saudi Arabia 0.69%, Vietnam 0.49%, Philippines 0.46%, Qatar 0.23% |
| Europe | Netherlands 4.07%, Germany 3.8%, United Kingdom 3.67%, France 2.19%, Belgium 1.92%, Italy 1.43%, Switzerland 1.38%, Spain 1.24%, Ireland 0.84%, Poland 0.55%, Sweden 0.43% |
| South America | Brazil 2.22%, Chile 0.93%, Colombia 0.87%, Peru 0.6%, Argentina 0.57%, Ecuador 0.39% |
| Oceania | Australia 1.67% |
| Africa | South Africa 0.35% |
How the figures compare with Census trade data
The Census Bureau’s year end table for 2023 gives total US goods exports of $2,019.5 billion, which rounds to the chart’s $2.02 trillion [2]. Its partner shares match the destination treemap: Canada 17.5% ($353.2 billion), Mexico 16.0% ($323.2 billion), China 7.3% ($147.8 billion), the Netherlands 4.1%, Germany 3.8% and the United Kingdom 3.7% [2].
The Observatory of Economic Complexity has since added 2024 data. It reports US exports of $1.9 trillion in 2024, led by crude petroleum ($124 billion), refined petroleum ($115 billion), petroleum gas ($84.8 billion), cars ($62.4 billion) and gas turbines ($52.2 billion), with Mexico ($283 billion) moving ahead of Canada ($273 billion) as the top destination [1]. OEC and Census totals differ slightly because they use different trade data sources.
Notes on this infographic
- Data year. The shares are for 2023. Rankings have shifted since, as the OEC 2024 figures above show [1].
- Truncated tiles. Many small tiles carry shortened names such as “Low-voltage Protection” or no label at all, so the product list above is not complete. The shares that are printed are transcribed as shown.
- Chinese Taipei is OEC’s label for Taiwan.
- Commodities not elsewhere specified (3.34%) is a catch all trade code, not a single product.
Questions about top US exports
What is the United States’ number one export?
On this chart it is crude petroleum, at 5.8% of 2023 US exports, just ahead of aircraft parts (5.61%) and refined petroleum (5.59%). OEC’s 2024 data also puts crude petroleum first, at $124 billion [1].
What are the top 5 exports of the United States?
By the 2023 shares on this treemap: crude petroleum (5.8%), aircraft parts (5.61%), refined petroleum (5.59%), petroleum gas (3.35%) and commodities not elsewhere specified (3.34%), with cars next at 3.12%.
Who are the largest trading partners of the United States?
For exports in 2023, Canada (17.5%), Mexico (16%) and China (7.32%), as the destination treemap shows. Census data for 2023 gives the same order [2].
Sources
- The Observatory of Economic Complexity, United States country profile. OEC is the data source and maker of the treemaps.
- US Census Bureau, Top Trading Partners, December 2023 (year to date).
Last reviewed 30 October 2026