How big is the US trade deficit?
The US imports far more goods than it exports, and has done every year since 1976 [2]. In 2025 the goods trade deficit was $1,259.6 billion, the largest calendar-year figure on record, and the deficit on goods and services combined was $932.0 billion [3]. For the first nine months of 2026 the goods deficit was $938.6 billion, 6.2% lower than in the same months of 2025 [3].
Those are balance of payments figures from the US Census Bureau and the Bureau of Economic Analysis (BEA), which publish the trade numbers together every month [3][4]. The Census Bureau revises recent years each June, so the 2024 and 2025 figures here come from the latest monthly release and may differ slightly from older tables.
US goods trade deficit by year
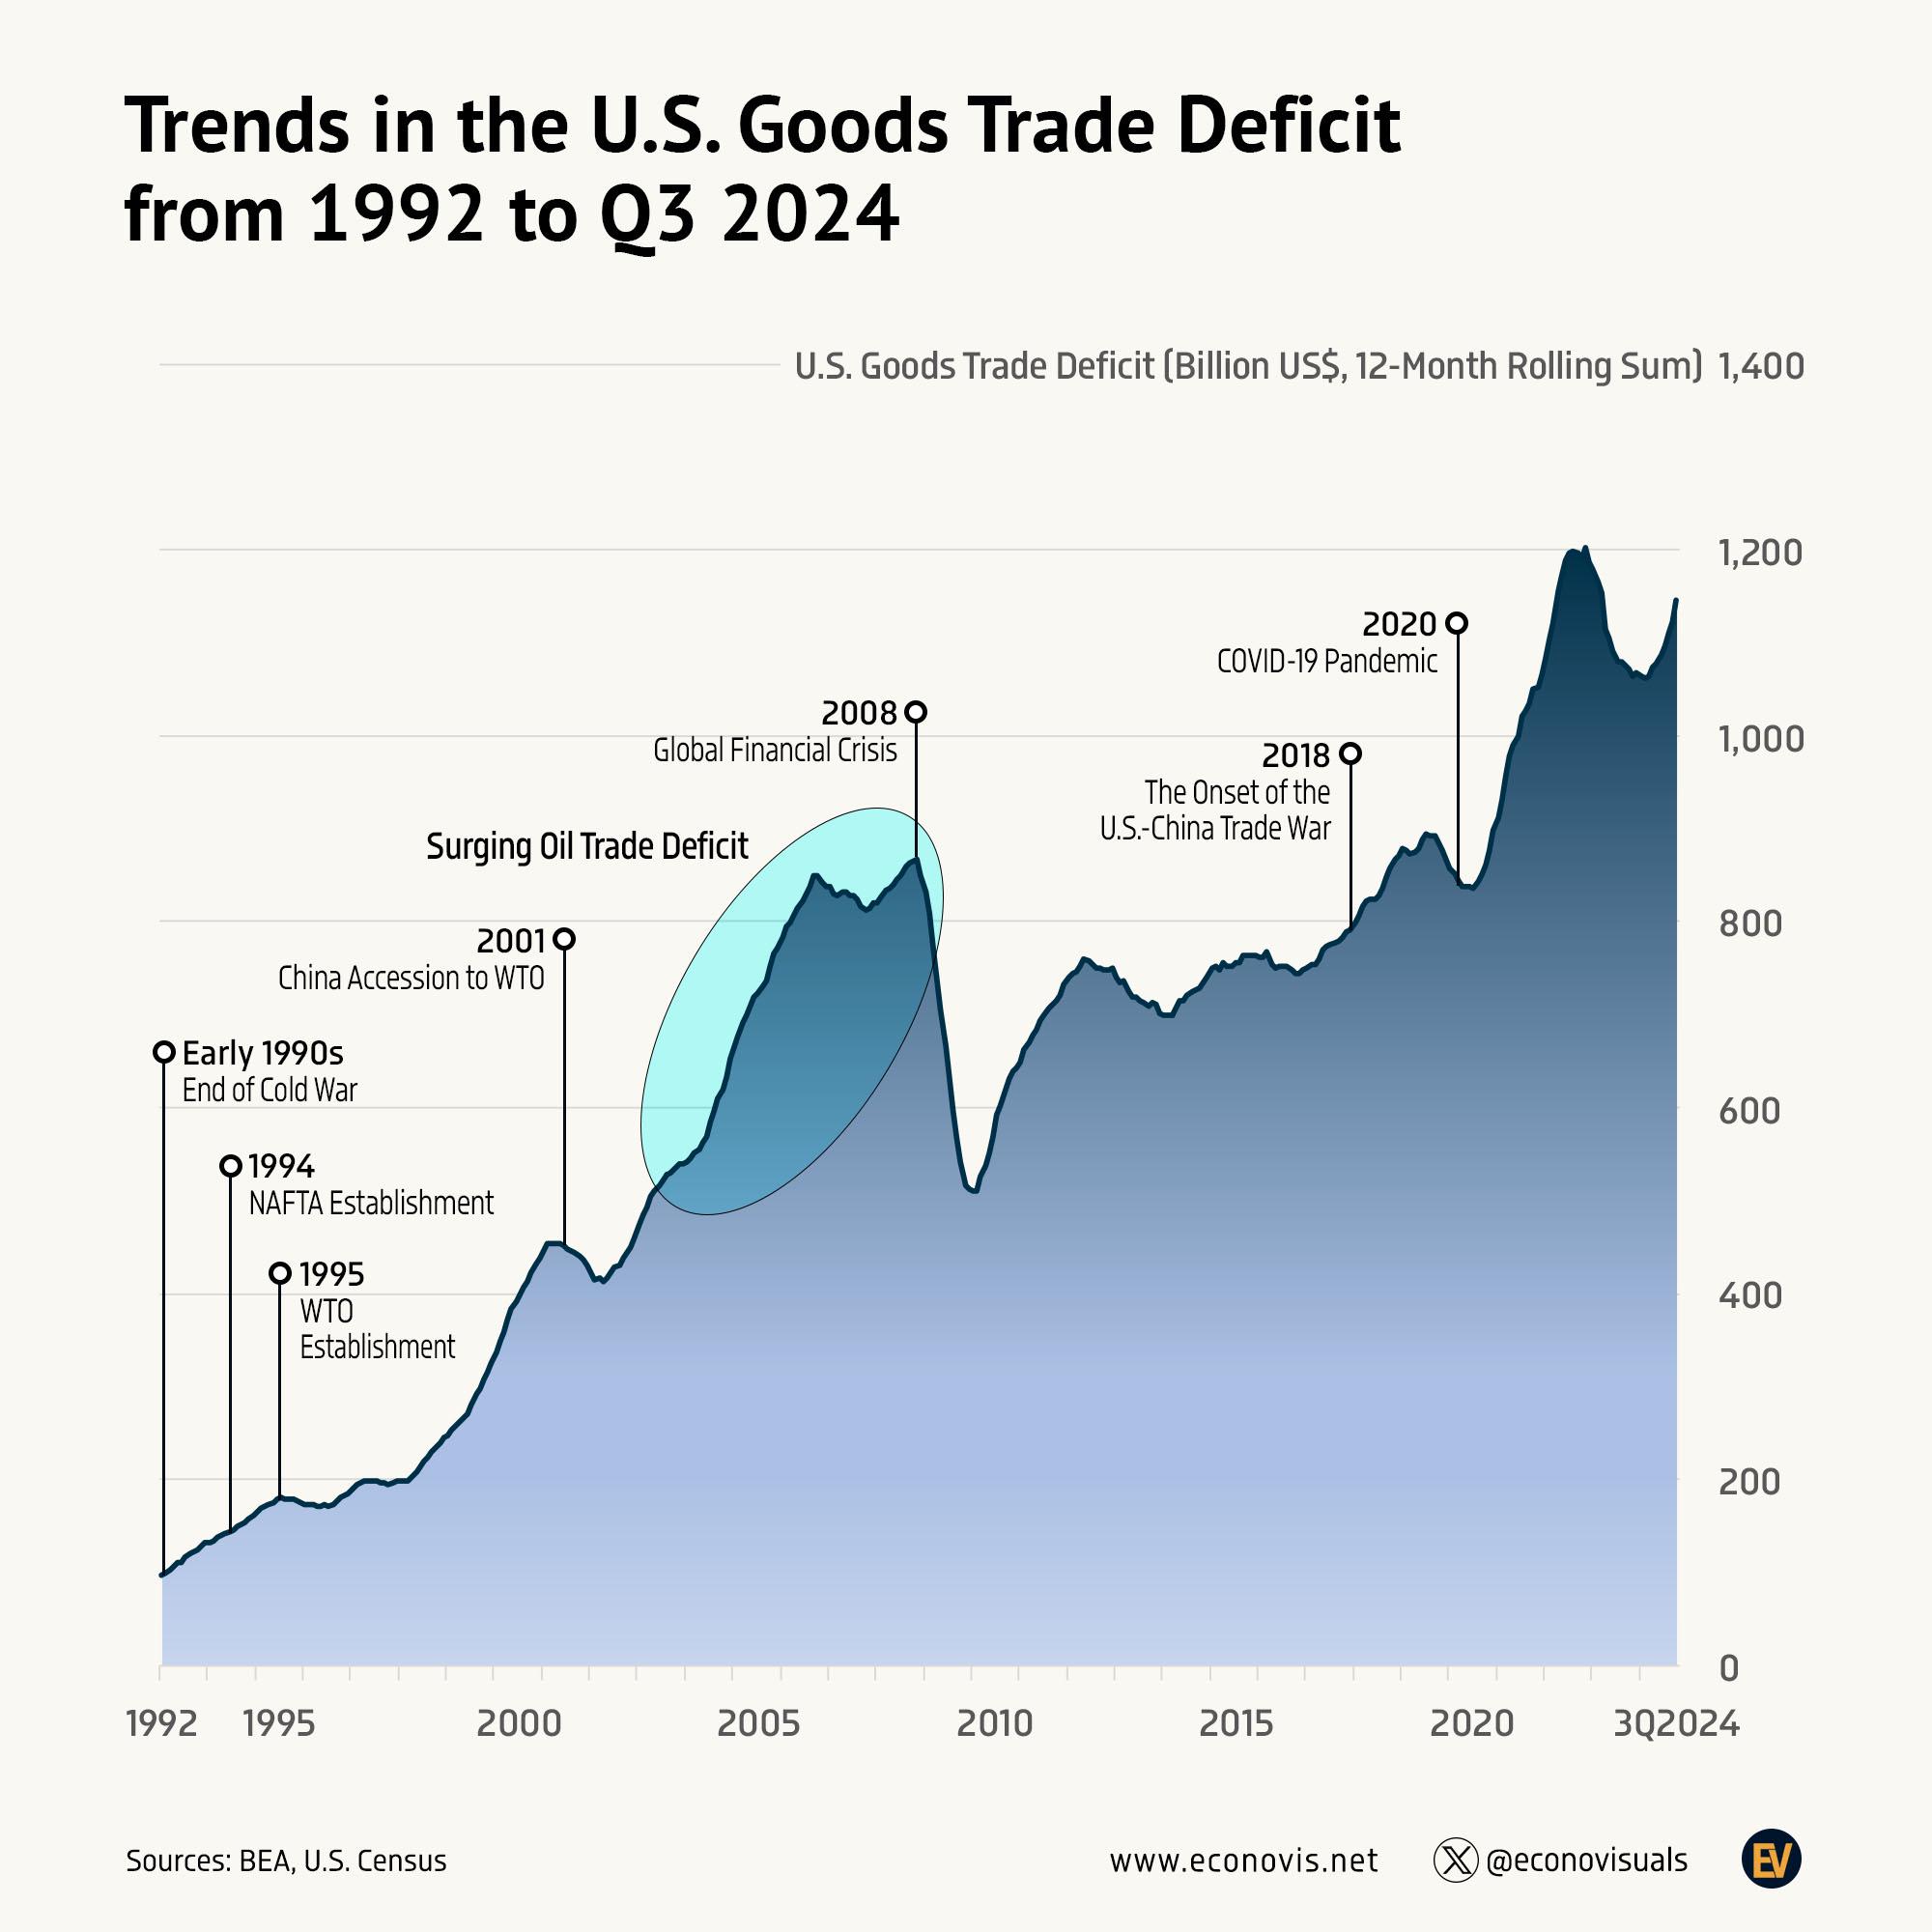
The table gives the goods deficit for selected years since 1992, the first year in the Econovis chart. The deficit has grown about 13 times over in that period, from under $100 billion to more than $1.2 trillion, but not in a straight line [2][3].
| Year | Goods trade deficit (billion US$) | What was happening |
|---|---|---|
| 1992 | 96.9 | Start of a long rise in imports |
| 1995 | 174.2 | NAFTA in force from 1994, WTO set up in 1995 |
| 2000 | 446.8 | Strong US consumer demand at the end of the 1990s boom |
| 2001 | 422.4 | US recession; China joins the WTO in December |
| 2006 | 837.3 | High oil prices and fast growth in imports from China |
| 2008 | 832.5 | Oil price peak, then the global financial crisis |
| 2009 | 509.7 | Imports collapse in the recession |
| 2013 | 700.5 | US oil production rising fast |
| 2018 | 878.7 | First US tariffs on Chinese goods |
| 2020 | 912.9 | COVID-19 pandemic; spending shifts from services to goods |
| 2021 | 1,083.2 | Goods deficit passes $1 trillion for the first time |
| 2022 | 1,174.6 | Post-pandemic import boom |
| 2023 | 1,057.5 | Imports ease |
| 2024 | 1,212.8 | Rise resumes |
| 2025 | 1,259.6 | Record year, with an import surge in the first quarter |
Figures to 2023 are from the Census Bureau’s historical series [2]; 2024 and 2025 are the revised figures in the September 2026 release [3]. The notes in the right-hand column give context and are not a full explanation of each year’s change.
Why the US trade deficit has grown since the 1990s
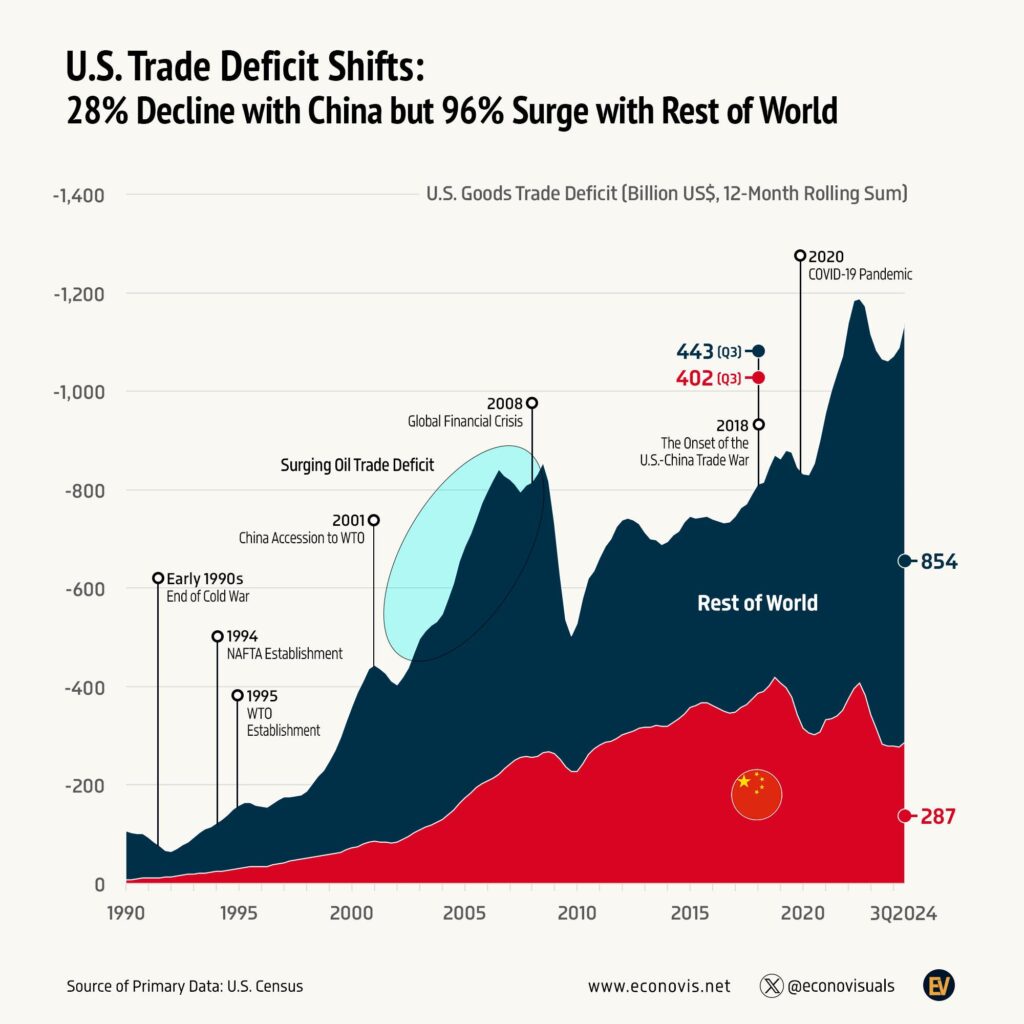
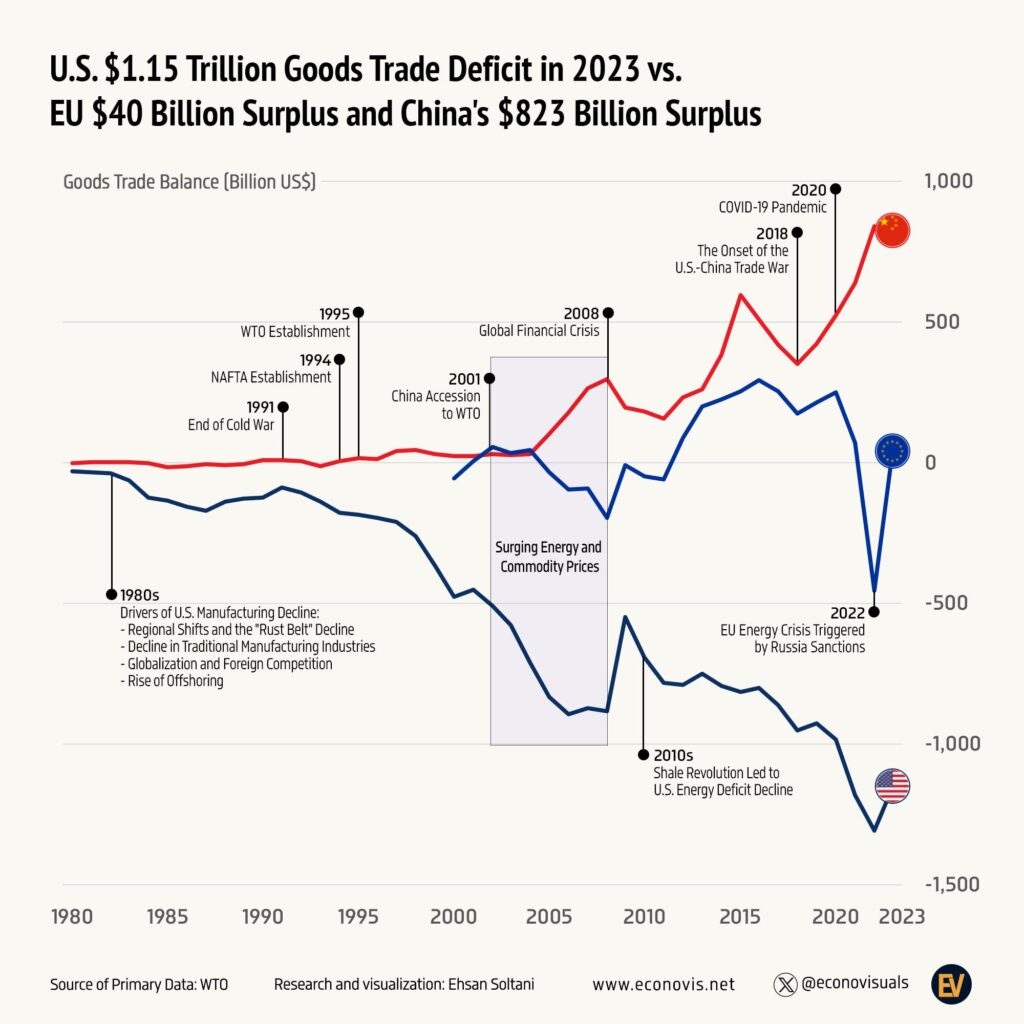
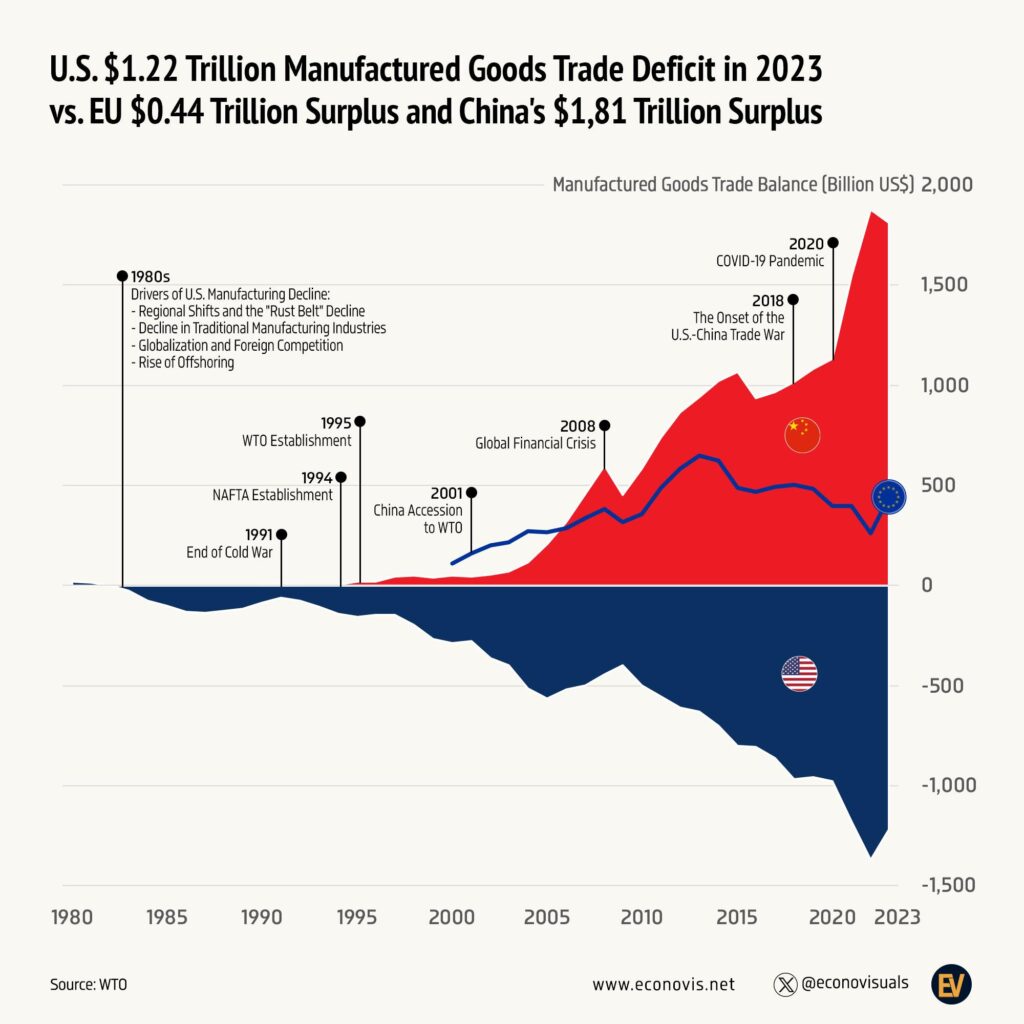
Econovis, which made the chart, puts the long rise down to trade liberalisation, globalisation, offshoring, free trade agreements, shifts in global oil markets and China’s emergence as a major trading partner [1]. Its infographic ties the rise to the big trade events of the period, from NAFTA in 1994 and China joining the World Trade Organization in 2001 to the 2018 trade war with China and the pandemic.
A chart like this shows timing rather than cause and effect, but a few forces explain most of the shape.
Spending more than the country produces
Economists usually start with saving and investment. A country that spends more than it produces, across households, businesses and government, has to buy the difference from abroad, and that shows up as a trade deficit. This is why the deficit tends to widen when the US economy is booming and shrink in recessions. You can see it clearly in 2001 and 2009, when the deficit fell as US demand dropped, and in 2021 and 2022, when stimulus and strong spending on goods pushed it to new highs [2].
Manufacturing moving to Asia
From the 1990s onwards, more of the goods Americans buy, from electronics to clothing and furniture, came to be made in Asia, and from 2001 especially in China. That moved a large share of manufacturing imports onto the trade balance. Since the 2018 tariffs, some of that trade has shifted from China to countries such as Vietnam, Mexico and Taiwan rather than coming back to the US. In the first nine months of 2026 the largest goods deficits were with Vietnam ($190.9 billion), Mexico ($184.0 billion), Taiwan ($171.1 billion) and China ($131.5 billion) [3].
Oil
Oil explains the steep climb in the mid 2000s that the chart highlights. US petroleum imports peaked in 2005 [5], and oil prices reached their high in mid 2008. Since then the shale boom has turned the picture round. In 2020 the US became a net exporter of petroleum for the first time since at least 1949, so oil now does far less to the deficit than it did 20 years ago [5]. The deficit kept growing anyway, which tells you the rest is driven by manufactured goods.
What happened to the deficit in 2025 and 2026
The Econovis chart stops in the third quarter of 2024, when the 12-month total was about $1.15 trillion and rising. The rise carried on into 2025. In the first three months of 2025, goods imports averaged about $331 billion a month, and the March goods deficit of $159.5 billion was the largest of any month in the series, just before the new US tariffs announced in April 2025 [3]. Imports then dropped back sharply, but the year still ended with the record $1,259.6 billion goods deficit [3].
In 2026 the deficit has moved the other way for most of the year. From January to April the monthly goods deficit was between $82 billion and $87 billion, well below 2025 levels, but it climbed again from May and was $135.9 billion in September 2026, with computers and computer accessories among the biggest rises in imports that month [3]. Year to date, both exports (up 11.6%) and imports (up 6.2%) were higher than in 2025, with exports rising faster [3].
Goods deficit versus total trade deficit
The chart, like most US trade deficit charts, tracks goods only. That is the bigger and more volatile part of the balance. The US runs a large surplus on services such as travel, financial services, software and intellectual property, which was $327.7 billion in 2025 [3]. So the headline goods and services deficit is a lot smaller than the goods figure: $932.0 billion against $1,259.6 billion in 2025 [3].
It also helps to know what the line in the chart measures. Econovis plots a 12-month rolling sum, where each point adds up the previous 12 months of trade. That smooths out monthly swings, and at the end of each December the rolling figure equals that calendar year’s total. Monthly figures on the news are a single month’s deficit, usually seasonally adjusted, so they look much smaller.
Is a trade deficit bad?
Not in itself, and economists disagree about how much it matters. A deficit means the country is buying more from abroad than it sells, and paying for the gap by selling assets such as government bonds, shares and property to foreign investors. That can be sustainable for a long time for a country like the US, whose dollar is the world’s main reserve currency and whose assets are in demand.
The concerns are mostly about particular industries and places. Rising imports of manufactured goods were linked to job losses in US manufacturing towns in the 2000s, and that is a big part of why trade deficits became a political issue and why tariffs came back in 2018 and 2025. Tariffs make imports dearer, but the overall deficit depends on the balance of spending and saving across the whole economy, which is why the 2018 tariffs did not bring the goods deficit down [2].
Questions about the US trade deficit chart
What is the current US trade deficit?
The goods and services deficit was $105.0 billion in September 2026, with a goods deficit of $135.9 billion and a services surplus of $30.9 billion [3]. The October figures are due on 8 December 2026.
When was the last time the US had a trade surplus?
1975, when the US had a goods and services surplus of $12.4 billion and a goods surplus of $8.9 billion. Every year since 1976 has been in deficit [2].
When did the US goods trade deficit pass $1 trillion?
In 2021, when it reached $1,083.2 billion [2]. It has stayed above $1 trillion every year since, with the highest annual figure so far in 2025 [3].
Did the trade deficit go up under Trump?
Yes, in both terms on an annual basis. The goods deficit rose from $749.8 billion in 2016 to $912.9 billion in 2020 [2], and from $1,212.8 billion in 2024 to a record $1,259.6 billion in 2025 [3]. The goods deficit for the first nine months of 2026 was lower than a year earlier, so 2026 may come in below 2025 [3].
Who does the US have the biggest trade deficit with?
In the first nine months of 2026 the largest goods deficit was with Vietnam, at $190.9 billion, followed by Mexico ($184.0 billion), Taiwan ($171.1 billion) and China ($131.5 billion), on a Census basis before seasonal adjustment [3]. For many years before that China was the largest by a wide margin.
Sources
- Econovis, Trends in the U.S. Goods Trade Deficit from 1992 to Q3 2024. The creator’s post with this chart.
- US Census Bureau, U.S. Trade in Goods and Services, Balance of Payments (BOP) Basis, 1960 through 2025 (PDF).
- US Census Bureau and BEA, U.S. International Trade in Goods and Services, September 2026 (PDF), released 4 November 2026. Exhibits 1, 14 and 19.
- US Bureau of Economic Analysis, U.S. International Trade in Goods and Services.
- US Energy Information Administration, Oil imports and exports.
Last reviewed 9 November 2026