Have you ever wondered how just a handful of tech giants managed to reshape the U.S. economic landscape in less than two decades?
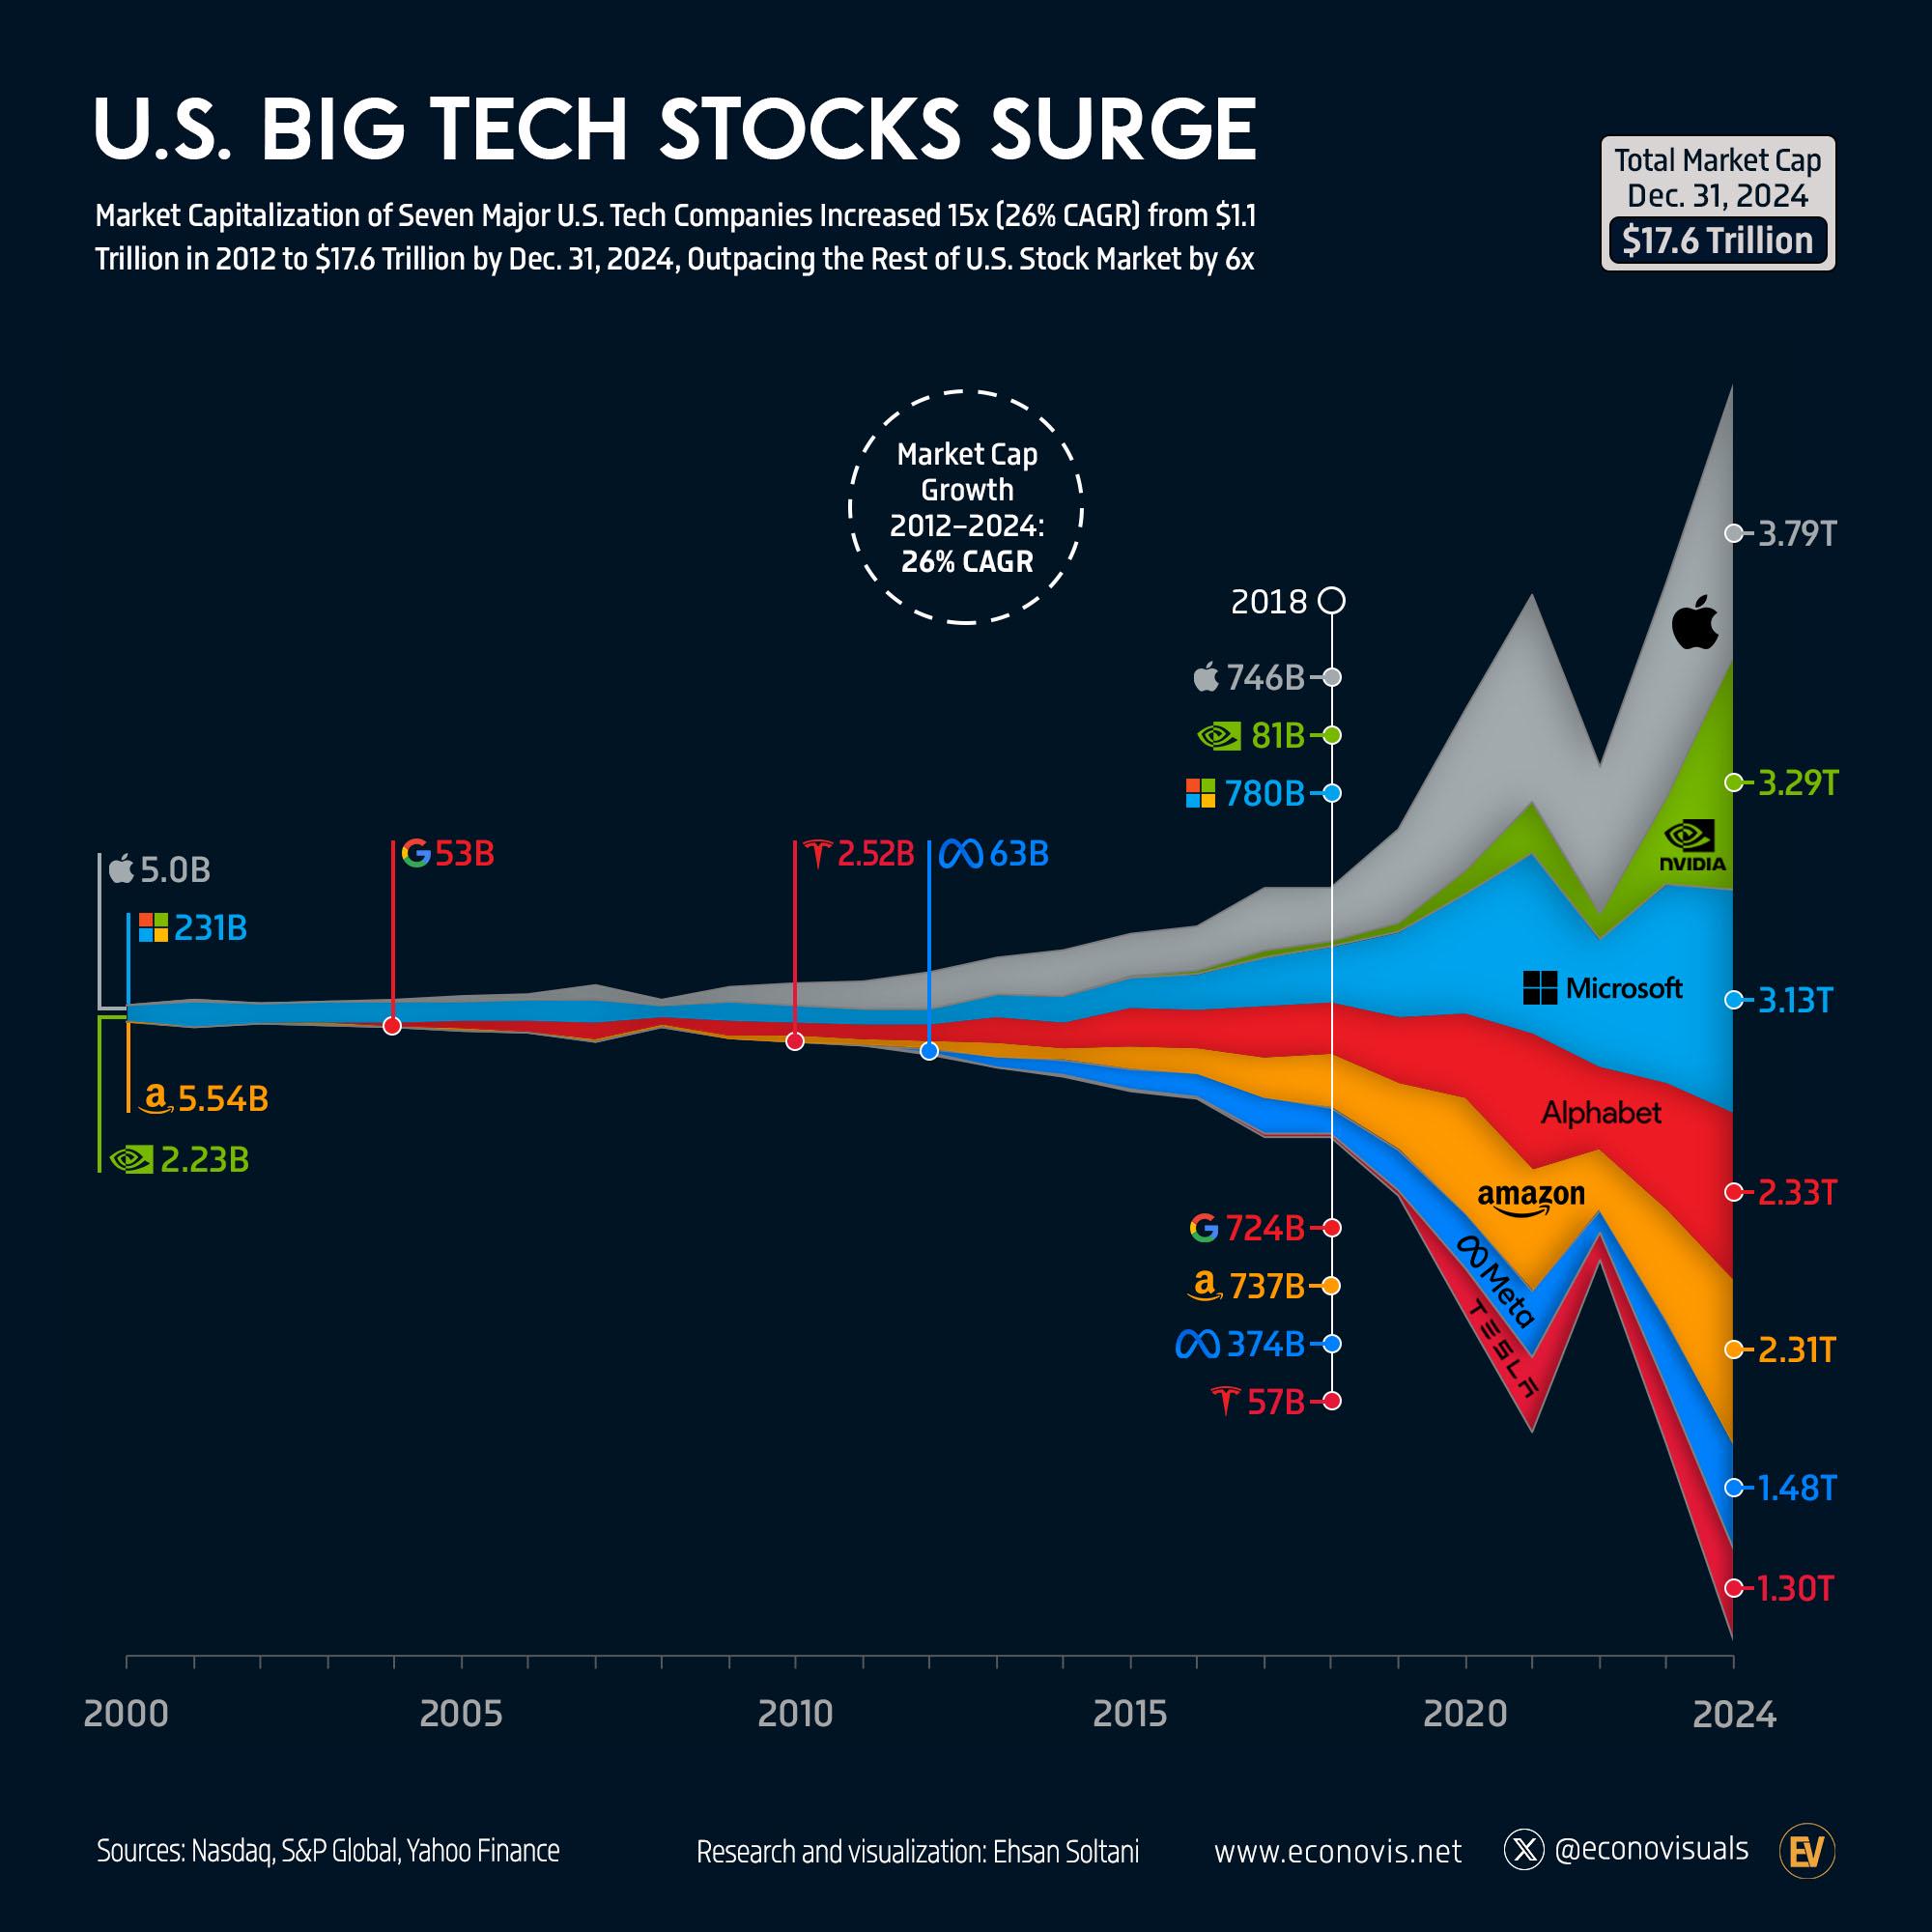
From a modest valuation of $1.1 trillion in 2012, the market capitalization of the "Magnificent Seven" soared to an astounding $17.6 trillion by 2024.
This meteoric rise, driven by an impressive compound annual growth rate of 26%, underscores their expanding influence on the stock market.
These tech behemoths, now commanding a significant 28% share, highlight a transformation that begs further exploration into their historical growth and future potential.
What drives such exponential growth in the U.S. Big Tech sector?
Find out as we dive deeper into their market dynamics.
Historical Growth of U.S. Big Tech Market Capitalization
The market capitalization of the seven leading U.S. technology companies, often referred to as the "Magnificent Seven," has seen a remarkable increase from $1.1 trillion in 2012 to an anticipated $17.6 trillion by the end of 2024. This extraordinary growth, 15.4 times over 12 years, underscores the significant expansion and influence these companies have had on the market. The rapid increase in value highlights the pivotal role technology plays in the modern economy, reflecting both investor confidence and the continuous innovation driven by these tech giants.
The compound annual growth rate (CAGR) for these companies during this period is an impressive 26%. This indicates a robust and sustained growth trajectory, suggesting that these tech companies are not only capitalizing on existing markets but are also pioneering new ones. The 26% CAGR showcases their ability to adapt swiftly to technological advancements and consumer demands, ensuring their competitive edge and market leadership. Such a consistent growth rate also implies a strong potential for continued expansion, providing further opportunities for investors and stakeholders.
| Year | Market Cap ($ Trillion) |
|——|————————-|
| 2012 | 1.1 |
| 2014 | 1.9 |
| 2016 | 3.4 |
| 2018 | 5.6 |
| 2020 | 8.9 |
| 2022 | 13.2 |
| 2024 | 17.6 |
The increasing dominance of these tech giants in the U.S. market is evident as their combined share of the total U.S. market capitalization has surged from 6% in 2012 to an anticipated 28% by the end of 2024. This shift indicates a significant concentration of market power within the tech industry, highlighting its pivotal role in shaping economic trends. The growing influence of these companies not only reflects their innovation and strategic growth but also raises questions about market dynamics and competition in the broader economic landscape.
Key Drivers of Market Capitalization Growth
What is a major driver of market capitalization growth for U.S. Big Tech companies? Artificial intelligence (AI) plays a pivotal role in driving investor confidence. The integration of AI into products and services has allowed these companies to enhance efficiencies, predict market trends more accurately, and cater to evolving consumer demands. Alongside AI, technological advancements have been instrumental in propelling growth. These advancements enable rapid adaptation to market dynamics, ensuring that tech giants remain at the forefront of innovation and market leadership.
- Innovation
- Market expansion
- Strategic partnerships
- Economic conditions
- Investor confidence
How do these factors collectively contribute to the growth of U.S. Big Tech companies? By fostering an environment of continuous innovation and adaptation, these drivers ensure sustained market relevance and competitive advantage. Innovation fuels product development, while market expansion opens new revenue streams. Strategic partnerships enhance capabilities and market reach, and favorable economic conditions provide a conducive environment for growth. Ultimately, these elements bolster investor confidence, which is crucial for maintaining high market valuations. Together, they create a robust framework that supports the impressive growth trajectory of Big Tech companies.
Comparative Analysis of Big Tech and Broader U.S. Market Growth
How does the growth of U.S. Big Tech companies compare to the broader U.S. stock market? The growth rate of U.S. Big Tech companies has significantly outpaced the broader market, expanding 15.4 times from 2012 to 2024, while the overall U.S. stock market grew only 3.3 times during the same period. This stark contrast highlights the accelerating momentum within the tech sector, driven by relentless innovation and strategic market positioning. The ability of these tech giants to rapidly scale and capture market share underscores their dominance and underscores the growing divide between tech and other sectors.
In 2024, how significant was the contribution of major tech companies to U.S. market gains? Eight major tech companies accounted for 53% of the gains in the U.S. stock market. This substantial contribution illustrates the outsized role that Big Tech plays in driving overall market performance. As these companies continue to capitalize on emerging technologies and expand their market influence, they have become pivotal in shaping market trends. Their substantial impact on market gains reflects both their financial prowess and their strategic importance in the broader economic landscape.
| Year | Big Tech Growth Rate | U.S. Stock Market Growth Rate |
|——|———————-|——————————|
| 2012 | 1.0 | 1.0 |
| 2014 | 1.7 | 1.2 |
| 2016 | 3.1 | 1.5 |
| 2018 | 5.1 | 2.0 |
| 2020 | 8.1 | 2.5 |
| 2022 | 12.0 | 3.0 |
| 2024 | 15.4 | 3.3 |
What are the implications of this comparative growth? The divergence in growth rates between Big Tech and the broader market suggests a shifting landscape where technology companies increasingly dominate market capitalization. This trend indicates a potential reallocation of investment focus towards tech stocks, as investors seek to capitalize on higher growth prospects. However, it also raises concerns about market concentration and the risks associated with over-reliance on a few key players. As these companies continue to grow, their influence on economic policy, regulatory scrutiny, and global market trends will likely intensify, necessitating careful consideration by investors and policymakers alike.
Current Valuations of Leading U.S. Tech Companies
As of June 13, 2024, the valuation landscape of the U.S. tech industry reveals a formidable presence in the global market. The 20 biggest tech companies by market capitalization showcase significant financial clout, reflecting their pivotal roles in the industry. Apple leads the pack with a staggering market cap of $3.79 trillion, followed closely by Microsoft at $3.13 trillion. Alphabet and Amazon also command substantial valuations of $2.31 trillion and $1.48 trillion, respectively. These figures underscore the immense value and influence these companies wield in the tech sector and beyond.
- Apple: $3.79 trillion
- Microsoft: $3.13 trillion
- Alphabet: $2.31 trillion
- Amazon: $1.48 trillion
- Another Major Tech Company: $XX trillion
The implications of these valuations are profound for both the market and investors. High valuations signify strong investor confidence and the expectation of continued growth and innovation. These valuations also highlight the dominant market positions these companies hold, influencing everything from consumer technology trends to global economic policies. As these tech giants continue to expand their reach and capabilities, their market capitalization not only reflects their past successes but also sets the stage for future advancements and strategic endeavors in the tech industry.
Future Projections and Market Influence of U.S. Big Tech
What is the projected market capitalization for U.S. Big Tech companies by the end of 2024? By December 31, 2024, the market capitalization of seven major U.S. tech companies is anticipated to reach $17.6 trillion, reflecting a 15-fold increase since 2012. This remarkable growth trajectory underscores the unprecedented expansion and scaling capabilities of these tech giants. As they continue to innovate and capture market share, their valuations are expected to rise further, potentially redefining market norms and benchmarks in the tech industry and beyond.
How might Big Tech's growth influence market trends and investor strategies? The substantial growth of Big Tech is likely to have a profound impact on market trends, driving increased investor interest and reshaping investment portfolios. As these companies continue to expand their technological capabilities and global reach, they attract significant capital inflows, influencing broader market dynamics. Investors may increasingly prioritize tech stocks, seeking to leverage the high growth potential and substantial returns associated with these companies. This shift in focus could lead to a greater concentration of investment in the tech sector, affecting overall market behavior and investment strategies.
What are the potential challenges and opportunities for Big Tech companies in the future? While the growth prospects for Big Tech remain robust, potential challenges such as regulatory scrutiny and market saturation could pose risks. As these companies expand, they may face increased regulatory oversight and competition, necessitating strategic adaptations. However, opportunities abound in emerging markets and new technological frontiers, such as artificial intelligence and blockchain. By navigating these challenges and capitalizing on new opportunities, Big Tech companies can sustain their growth trajectory and continue to exert significant influence over the global market landscape.
Final Words
The extraordinary growth of U.S. Big Tech companies over the last decade demonstrates their significant influence in the financial landscape.
The market capitalization of the "Magnificent Seven" soared from $1.1 trillion in 2012 to an impressive $17.6 trillion by the end of 2024.
This growth, driven by advancements in AI and strategic market maneuvers, showcases their pivotal role in shaping market trends.
Comparatively, Big Tech's expansion outstripped the broader U.S. stock market, highlighting their key contribution to market gains.
As these tech giants continue to lead, understanding the U.S. Big Tech Stocks Market Capitalization Growth is essential for predicting future trends.
This upward trajectory not only benefits investors but also heralds a future filled with innovation and economic impact.

