Homeless population by city in 2025
HUD’s latest count, taken on a single night in January 2025, found 745,652 people experiencing homelessness in the United States, 3% fewer than the record 771,480 in 2024 [1][2]. More than half of them, 390,782 people, were counted in the areas covering the 50 largest cities [1]. These are the US cities with the most homeless people in 2025, by Continuum of Care (the local area HUD counts by) [3]:
| Rank | Area | People experiencing homelessness, Jan 2025 | Jan 2022 |
|---|---|---|---|
| 1 | New York City | 125,683 | 61,840 |
| 2 | Los Angeles City and County | 67,777 | 65,111 |
| 3 | Seattle/King County | 16,936 | 13,368 |
| 4 | Metropolitan Denver | 10,774 | 6,884 |
| 5 | San Jose/Santa Clara County | 10,711 | 10,028 |
| 6 | Portland/Multnomah County | 10,526 | 5,228 |
| 7 | San Diego City and County | 9,905 | 8,427 |
| 8 | Phoenix, Mesa/Maricopa County | 9,734 | 9,026 |
| 9 | Oakland, Berkeley/Alameda County | 9,262 | 9,747 |
| 10 | San Francisco | 8,671 | 7,754 |
Massachusetts and Texas “balance of state” areas also had more than 9,000 people each in 2025, but they cover large parts of those states rather than a city, so they are left out here [3].
How the ranking has changed since 2022
The Statista infographic on this page shows HUD’s January 2022 count, when Los Angeles was top with 65,111 people, just ahead of New York City with 61,840, followed by Seattle/King County (13,368), San Jose/Santa Clara (10,028) and Oakland/Alameda County (9,747) [4]. Every figure on the graphic matches HUD’s data. Six of the ten areas were in California, and the national total was 582,462 [4].
Since then the biggest change has been in New York City, where the count more than doubled to 140,134 in 2024 before falling to 125,683 in 2025 [3]. HUD says the rise in New York, and in Chicago, was driven at least in part by the arrival of asylum seekers, many of whom were housed in city shelters [1][2]. Chicago’s count reached 18,836 in 2024, with new arrivals accounting for more than 13,600 people in its emergency shelters, then fell by about 60% to 7,452 in 2025 as fewer asylum seekers arrived [1][3].
Denver and Portland also rose sharply, and Sacramento dropped out of the top 10. Los Angeles has stayed between about 65,000 and 72,000 throughout [3].
US cities with the most homeless people per capita
Raw numbers favour big cities. Per head of population, the picture changes. Using HUD’s 2025 counts and the Census Bureau’s 2024 population estimates for the counties each area covers, we get these rough rates [3][5]:
| Area | Homeless per 10,000 residents (2025) |
|---|---|
| New York City | 148 |
| Portland/Multnomah County | 132 |
| San Francisco | 105 |
| Seattle/King County | 72 |
| Los Angeles County | 69 |
| San Jose/Santa Clara County | 56 |
| Oakland/Alameda County | 56 |
| Metropolitan Denver | 32 |
| Las Vegas/Clark County | 32 |
| San Diego County | 30 |
| Phoenix/Maricopa County | 21 |
These are our own sums, so treat them as approximate. The Los Angeles figure is a little low, because Long Beach, Pasadena and Glendale run separate counts but are included in the county population. The national rate is about 22 people per 10,000 [1].
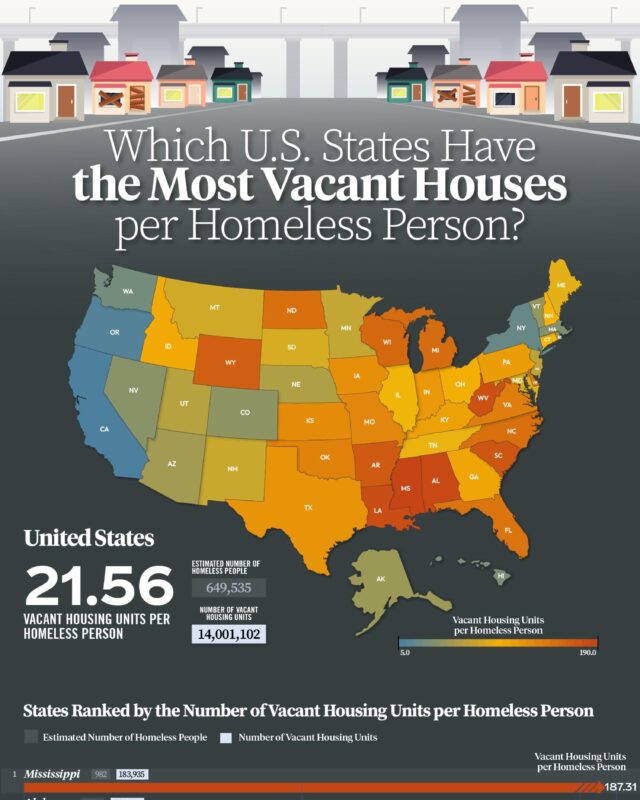
By state, HUD puts the highest rates in New York and the District of Columbia (73 per 10,000 each), Oregon (64), Vermont (52), Hawaii (47) and California (46). Mississippi has the lowest at 4 per 10,000 [1].
Sheltered and unsheltered homelessness
The kind of homelessness differs a lot between cities. New York has a legal right to shelter, so 96% of the 125,683 people it counted in 2025 were in shelters and only 4,673 were unsheltered [3]. In Los Angeles it is the other way round: 44,415 of 67,777 people, about two thirds, were living on the street, in cars or in encampments [3]. Portland (66% unsheltered), Seattle/King County (58%) and San Francisco (50%) also have large unsheltered populations [3].
That is why homelessness can look worse on the street in West Coast cities even where the total is much lower than New York’s. Nationally, 36% of people counted in 2025 were unsheltered [1].
How homelessness is counted
Every January, each of the 386 Continuums of Care in the US counts the people staying in shelters and transitional housing and sends volunteers out to count people sleeping outside, in vehicles and in other places not meant for living. This is the point in time count, and HUD publishes it in its Annual Homelessness Assessment Report to Congress [1].
A Continuum of Care can cover a city, a county or a whole state, which is why “Los Angeles” here means the city and most of the county, and “Seattle” means all of King County [1]. The count only includes people who are literally homeless on that night. People staying with friends or family (“doubling up”) are not counted, and HUD says the true unsheltered number is probably higher than reported because some people are hard to find [1].
Questions about homeless population by city
What city has the highest homeless population in the US?
New York City, with 125,683 people in HUD’s January 2025 count, almost twice the 67,777 in Los Angeles [3]. In 2022 Los Angeles was slightly higher [4].
What are the top 10 cities in the US for homelessness?
In 2025: New York City, Los Angeles, Seattle/King County, Metropolitan Denver, San Jose/Santa Clara, Portland, San Diego, Phoenix/Maricopa County, Oakland/Alameda County and San Francisco [3].
Which US city has the most homeless people per capita?
Among large cities, New York (about 148 per 10,000 residents) and Portland (about 132) are highest on our calculation from 2025 HUD counts, followed by San Francisco (about 105) [3][5].
How many homeless people are there in the US?
745,652 on a single night in January 2025, down from a record 771,480 in 2024 but up from 582,462 in 2022 [1][2][4].
How many homeless people are there in New York City?
125,683 in January 2025, of whom 121,010 were in shelters [3].
Sources
- US Department of Housing and Urban Development, The 2025 Annual Homelessness Assessment Report to Congress, Part 1, May 2026.
- US Department of Housing and Urban Development, The 2024 Annual Homelessness Assessment Report to Congress, Part 1.
- US Department of Housing and Urban Development, 2007 to 2025 point in time counts by CoC (data file).
- US Department of Housing and Urban Development, The 2022 Annual Homelessness Assessment Report to Congress, Part 1.
- US Census Bureau, County population totals, Vintage 2024 (rates per 10,000 are our sums).
Last reviewed 7 November 2026