The US oil trade balance for crude is still a deficit, but a far smaller one than it was. In 2025 the United States imported 6.17 million barrels of crude a day and exported 3.96 million, leaving net imports of 2.21 million barrels a day, according to the U.S. Energy Information Administration (EIA). In 2005 the gap was 10.1 million barrels a day. Counting refined products as well, the US has been a net oil exporter since 2020.
US oil exports vs imports by year
The EIA’s annual figures show how the crude balance has moved since the 1970s [2]. Net imports are imports minus exports (our arithmetic).
| Year | Crude imports, million barrels a day | Crude exports, million barrels a day | Net crude imports |
|---|---|---|---|
| 1970 | 1.32 | 0.01 | 1.31 |
| 1977 | 6.62 | 0.05 | 6.57 |
| 1985 | 3.20 | 0.20 | 3.00 |
| 2000 | 9.07 | 0.05 | 9.02 |
| 2005 | 10.13 | 0.03 | 10.09 |
| 2010 | 9.21 | 0.04 | 9.17 |
| 2015 | 7.36 | 0.47 | 6.90 |
| 2018 | 7.77 | 2.05 | 5.72 |
| 2020 | 5.88 | 3.21 | 2.67 |
| 2022 | 6.28 | 3.58 | 2.71 |
| 2023 | 6.49 | 4.08 | 2.41 |
| 2024 | 6.59 | 4.09 | 2.50 |
| 2025 | 6.17 | 3.96 | 2.21 |
Crude imports peaked at 10.13 million barrels a day in 2005. Exports reached a record 4.09 million in 2024. Over the 12 months to November 2024, Econovis measured exports of 4.17 million, imports of 6.58 million and a deficit of 2.40 million barrels a day [1], in line with the EIA’s annual numbers.
In 2026 so far the gap has narrowed again. From January to August the US imported an average of 6.32 million barrels a day and exported 4.49 million, net imports of about 1.83 million (our average of the EIA’s monthly figures) [2]. Exports hit 5.59 million in April and 5.73 million in May 2026, when buyers in Asia and Europe looked for oil from outside the Gulf.
Why the deficit shrank, from 10 million barrels a day to about 2
Three things changed the balance.
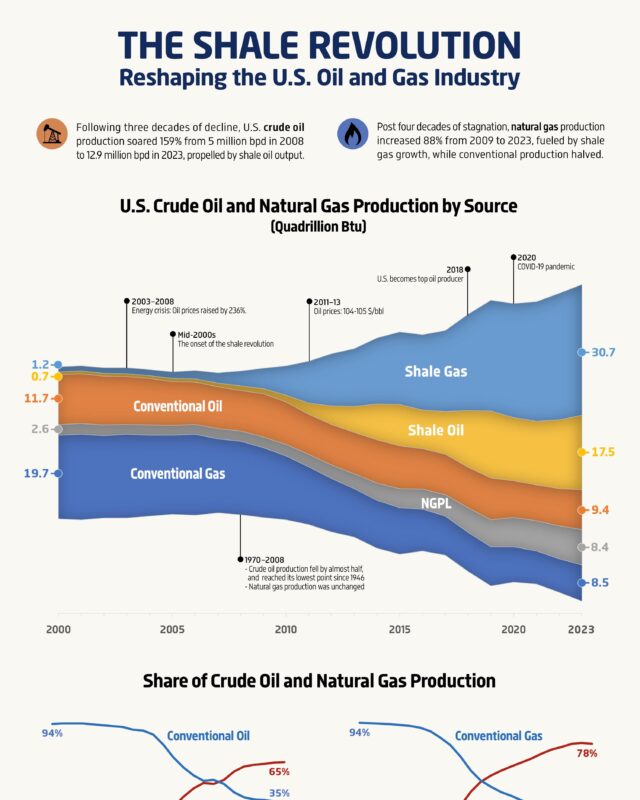
- Falling and then rising production. US crude output peaked at 9.64 million barrels a day in 1970 and fell to 5.00 million by 2008, its lowest since the 1940s [2][4]. Imports filled the gap.
- Shale. Horizontal drilling and hydraulic fracturing turned the decline round from 2009 [4]. Output reached 12.97 million barrels a day in 2023 and 13.66 million in 2025 [2]. The US has been the world’s largest crude producer since 2018 [4].
- The end of the export restrictions. US crude exports were tightly limited for 40 years until Congress lifted the rules in December 2015. Exports were 0.47 million barrels a day in 2015 and 2.05 million by 2018 [2].
Imports fell by about a third from the 2005 peak, while exports grew from almost nothing. Most of the narrowing has come from exports, not from cutting imports.
Why the US still imports crude oil
If the US produces more crude than it imports and exports combined, why does it still buy 6 million barrels a day from abroad? The answer is the type of oil. Shale fields mostly produce light, sweet crude, while many refineries on the Gulf Coast and in the Midwest were built to run heavier, sourer grades from Canada, Mexico, Venezuela and the Middle East. It is often cheaper to export light oil and import heavy oil than to rebuild refineries.
Geography matters too. Refineries in the Midwest sit at the end of pipelines from Canada, and refiners on the West Coast have few pipeline links to Texas, so they buy crude by sea.
Where US crude imports come from
Canada dominates. In 2025 it supplied 3.91 million barrels a day, 63% of US crude imports (our arithmetic from EIA data) [3]. Econovis put Canada’s share at 61% in 2024, a record 4.0 million barrels a day [5].
| Country | 2023 | 2024 | 2025 |
|---|---|---|---|
| Canada | 3,885 | 4,062 | 3,910 |
| Mexico | 733 | 464 | 383 |
| Saudi Arabia | 349 | 274 | 269 |
| Guyana | 98 | 176 | 208 |
| Brazil | 186 | 221 | 198 |
| Colombia | 202 | 214 | 194 |
| Iraq | 213 | 198 | 179 |
| Nigeria | 153 | 154 | 137 |
| All countries | 6,489 | 6,588 | 6,168 |
Thousand barrels of crude a day. Source, EIA imports by country of origin [3].
Mexico’s supply has halved since 2023 as its own refineries take more of its crude. Guyana, which only began producing in 2019, is now the fourth largest source. Imports from OPEC countries fell to 0.83 million barrels a day in 2025 [3]. For a wider view of where the world’s oil sits, see our page on the largest oil reserves by country.
Where US crude exports go
Europe and Asia buy most of it. The Netherlands, a hub for refineries and onward trade into Europe, took 0.86 million barrels a day in 2025, 22% of US crude exports. South Korea took 0.51 million, Canada 0.38 million, India 0.32 million and Taiwan 0.22 million [6].
China has dropped away as a buyer. It took 0.46 million barrels a day of US crude in 2023 but only 23,000 in 2025, as trade tensions grew [6]. For how China replaced it, see our page on China oil imports by country.
Crude oil versus all petroleum, why the US is a net exporter
The crude balance is only half of the story. The US exports far more refined products, such as diesel, gasoline and propane, than it imports. Counting crude and products together, US imports in 2025 were 7.94 million barrels a day and exports 10.79 million, so the US was a net exporter of 2.85 million barrels a day [2].
| Year | Net crude imports | Net imports of crude and products |
|---|---|---|
| 2015 | 6.90 | 4.71 |
| 2019 | 3.82 | 0.67 |
| 2020 | 2.67 | minus 0.64 (net exporter) |
| 2023 | 2.41 | minus 1.71 (net exporter) |
| 2025 | 2.21 | minus 2.85 (net exporter) |
Million barrels a day, our arithmetic from EIA totals [2]. In 2020 the US became a net petroleum exporter for a full year for the first time in decades, and the surplus has grown each year since.
Questions about the US oil trade balance
Who does the USA import the most oil from?
Canada, by a wide margin. It supplied 3.91 million barrels a day of crude in 2025, 63% of US crude imports. Mexico, Saudi Arabia, Guyana and Brazil came next [3].
How much oil does America export per year?
The US exported 3.96 million barrels of crude a day in 2025, about 1.45 billion barrels over the year. Including refined products, exports were 10.79 million barrels a day, about 3.9 billion barrels a year (our arithmetic) [2].
Is the US a net exporter of oil?
Of crude oil alone, no: it imported 2.21 million barrels a day more than it exported in 2025. Of crude and refined products together, yes, by 2.85 million barrels a day [2].
When did the US start exporting crude oil again?
After Congress lifted the long standing export restrictions in December 2015. Exports grew from under half a million barrels a day in 2015 to more than 4 million by 2023 [2].
Why does the US import oil if it is the largest producer?
Because many US refineries are set up for heavier crude than shale fields produce, and some regions are easier to supply by sea or pipeline from abroad than from Texas. The US exports light crude and imports heavy crude.
Sources
- Econovis, U.S. Crude Oil Trade Balance (Nov 2024, LTM), using EIA data.
- U.S. Energy Information Administration, U.S. Imports of Crude Oil, with the matching series for crude exports, crude production and total petroleum imports and exports, annual and monthly data to August 2026.
- U.S. Energy Information Administration, U.S. Imports by Country of Origin.
- U.S. Energy Information Administration, United States produces more crude oil than any country, ever, 11 March 2024.
- Econovis, Canada Supplied 61% of U.S. Crude Oil Imports in 2024.
- U.S. Energy Information Administration, U.S. Exports to Destination.