Key points from the chart
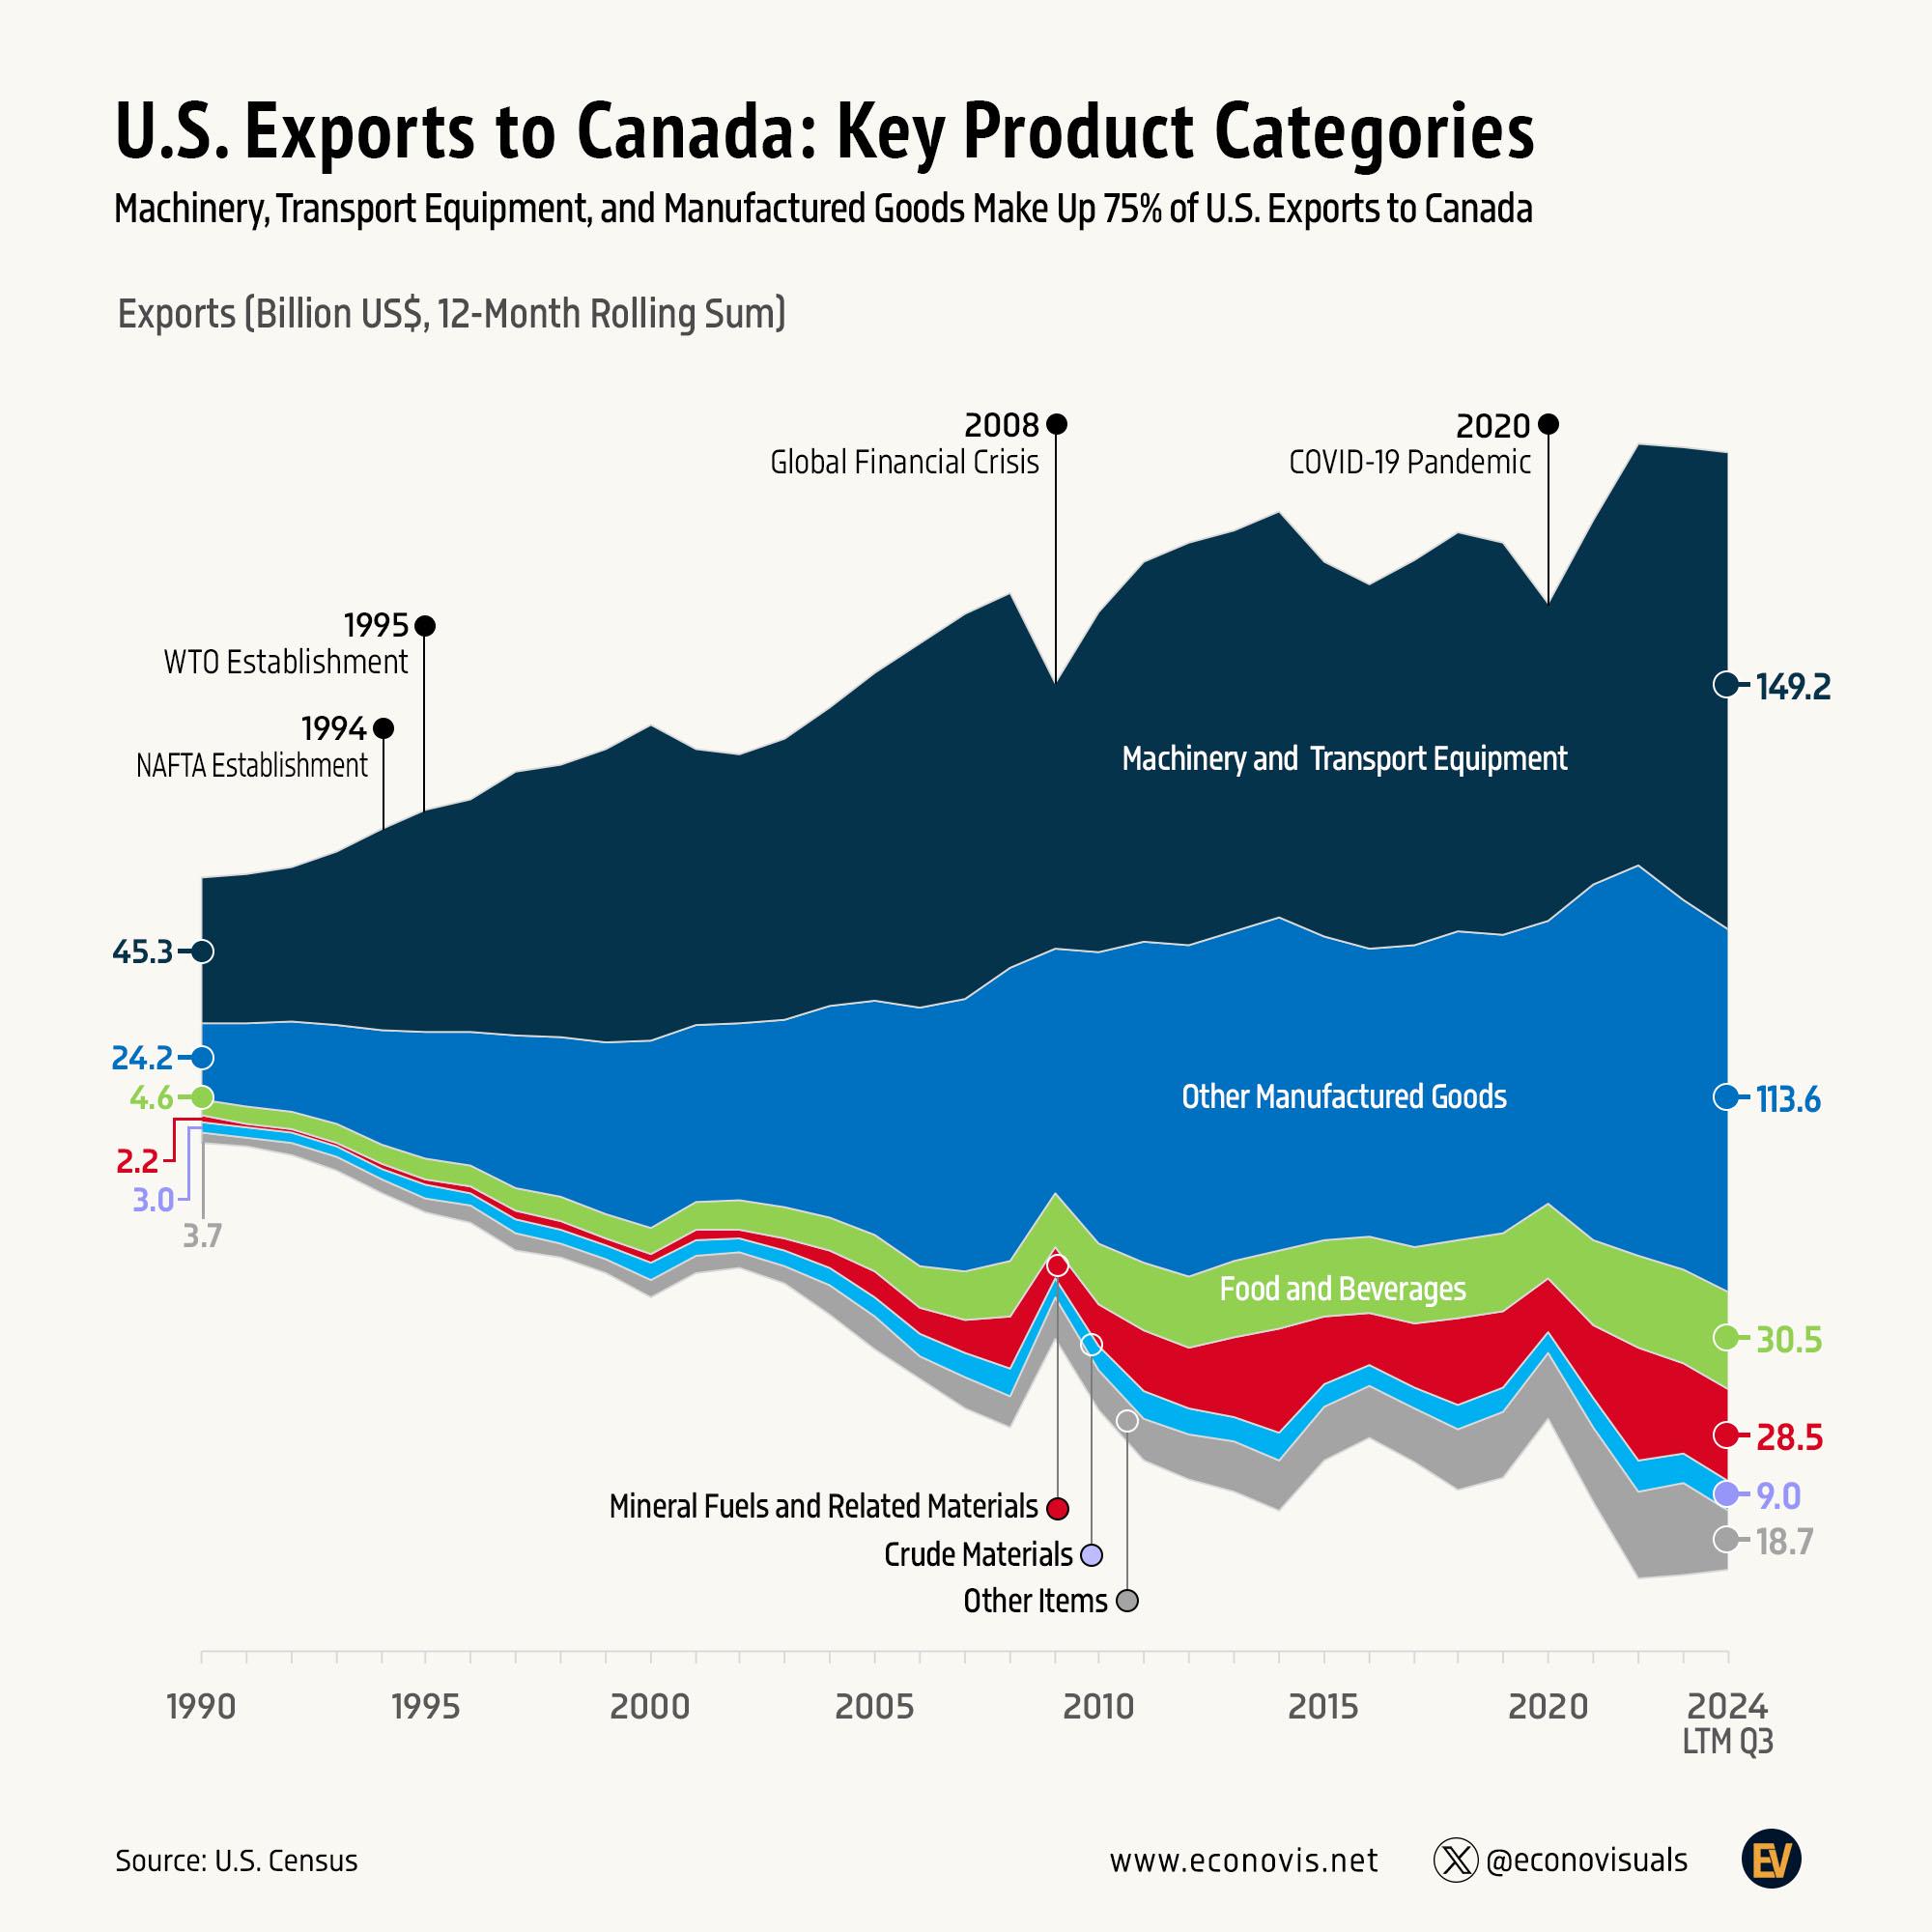
- The chart shows US exports to Canada by product category from 1990 to the 12 months ending in the third quarter of 2024, in billions of US dollars.
- Machinery and transport equipment is the largest category, at $149.2 billion, followed by other manufactured goods at $113.6 billion. Together they make up the 75% in the chart’s subtitle.
- Food and beverages ($30.5 billion) and mineral fuels ($28.5 billion) are the next largest.
- The printed values add up to about $83 billion in 1990 and $349.5 billion in 2024, roughly four times higher (our sums).
- Mineral fuels grew fastest, from $2.2 billion to $28.5 billion, about 13 times higher.
The US exports to Canada chart in text
Title: U.S. Exports to Canada, Key Product Categories. Subtitle: Machinery, Transport Equipment, and Manufactured Goods Make Up 75% of U.S. Exports to Canada. Unit: Exports (Billion US$, 12-Month Rolling Sum). The horizontal axis runs from 1990 to 2024, marked LTM Q3 (the last twelve months to the third quarter).
The chart is a stacked stream chart, so the bands widen both upwards and downwards as exports grow, and there is no vertical scale. Values are printed only at the two ends. Event labels: 1994, NAFTA Establishment. 1995, WTO Establishment. 2008, Global Financial Crisis. 2020, COVID-19 Pandemic.
| Category (colour) | 1990 ($bn) | 2024, 12 months to Q3 ($bn) | Share of 2024 total (our sum) |
|---|---|---|---|
| Machinery and Transport Equipment | 45.3 | 149.2 | 42.7% |
| Other Manufactured Goods | 24.2 | 113.6 | 32.5% |
| Food and Beverages | 4.6 | 30.5 | 8.7% |
| Mineral Fuels and Related Materials | 2.2 | 28.5 | 8.2% |
| Crude Materials | 3.0 | 9.0 | 2.6% |
| Other Items | 3.7 | 18.7 | 5.4% |
| Total (our sum of the printed values) | 83.0 | 349.5 | 100% |
Footer: Source, U.S. Census. www.econovis.net, @econovisuals and the Econovis EV logo.
What the chart shows over time
The bands grow through the 1990s and 2000s, after the NAFTA and WTO labels. There is a visible pinch around 2009 after the financial crisis and another in 2020 during the pandemic, followed by a rise to the widest point of the chart around 2022 and a slight narrowing into 2024. These shapes are read from the graphic, which prints no values between the two ends.
In 1990, machinery and transport equipment and other manufactured goods made up about 84% of the total by our sum of the printed values, compared with about 75% in 2024. The smaller categories, especially mineral fuels and food, took a larger share over the period.
How the chart compares with Census and USTR figures
The US Census Bureau’s table of US goods trade with Canada gives exports of $83.7 billion in 1990 and $350.6 billion in 2024, close to the chart’s totals [2]. It also shows imports from Canada were higher than exports in both years, so the US ran a goods deficit with Canada, $61.2 billion in 2024 [2].
The Office of the US Trade Representative says that in 2024 Canada was the top destination for US exports and the third largest source of US imports. It lists vehicles, machinery and energy products as the leading US exports to Canada, together with over $30 billion in agricultural products [3]. For 2025, it reports US goods exports to Canada of $333.6 billion, down 4.8% from 2024 [3].
Notes on this infographic
- Category mix-up in the creator’s post. Econovis’s text says crude materials contributed $29 billion (8.2%) [1]. On the chart, $28.5 billion (8.2%) is mineral fuels and related materials, while crude materials is $9.0 billion.
- Colour key. The marker for crude materials is drawn in lavender, while its band is light blue.
- Goods only. The chart covers goods. USTR reports a separate US services surplus with Canada [3].
- Totals are our sums. The chart does not print a total. The totals and shares in the table are our arithmetic from the printed values.
Questions about US exports to Canada
What does the US export to Canada?
Mostly manufactured goods. On this chart, machinery and transport equipment ($149.2 billion) and other manufactured goods ($113.6 billion) make up about three quarters of US exports to Canada in the year to the third quarter of 2024, followed by food and beverages and mineral fuels. USTR names vehicles, machinery and energy products as the leading exports [3].
What is the biggest export of the US to Canada?
Machinery and transport equipment, at $149.2 billion on this chart. Econovis puts it at 42.7% of the total [1].
How much food does Canada buy from the US?
The chart shows $30.5 billion of food and beverages in the year to the third quarter of 2024. USTR says US exports to Canada include over $30 billion in agricultural products, such as bakery goods, cereals and pasta, fresh vegetables and fruit, and ethanol [3].
Sources
- Econovis, Machinery, Transport Equipment, and Manufactured Goods Make Up 75% of U.S. Exports to Canada (4 January 2025), the creator’s post of this chart.
- US Census Bureau, Trade in Goods with Canada.
- Office of the US Trade Representative, Canada.
Last reviewed 30 October 2026