How much have US home prices risen since 2000?
A lot, and unevenly. On Zillow’s Home Value Index, the typical US home was worth $122,626 in January 2000 and $366,157 in September 2026, almost exactly three times as much [1]. The S&P Cotality Case-Shiller national index, which tracks repeat sales of the same homes, rose about 3.4 times over the same period, from 100 in January 2000 to 336.7 in August 2026 [4]. These are nominal prices, not adjusted for inflation.
The rise was not a straight line. Prices went through a boom to 2006 and 2007, a crash that lasted until early 2012, a long steady recovery and then a very sharp jump after 2020. The table below shows the typical value of homes at the bottom, middle and top of the market at each turning point, using Zillow’s smoothed, seasonally adjusted series for the United States [1]:
| Date | Bottom tier | Mid tier (typical home) | Top tier |
|---|---|---|---|
| January 2000 | $58,871 | $122,626 | $243,328 |
| Pre-crash peak | $97,895 (May 2007) | $209,819 (April 2007) | $453,960 (September 2006) |
| Post-crash low | $77,117 (January 2012) | $159,064 (February 2012) | $330,937 (February 2012) |
| January 2020 | $128,804 | $248,883 | $494,632 |
| September 2025 | $193,509 | $361,859 | $695,793 |
| September 2026 | $197,716 | $366,157 | $706,421 |
| Growth since January 2000 | 3.36 times | 2.99 times | 2.90 times |
The growth figures are our arithmetic from Zillow’s data. Zillow revises its history from time to time, so older charts built on its data, including the one on this page, can show slightly different values.
What is the average home price in the US?
There is no single figure, because each source measures something slightly different. The latest numbers are:
- Zillow typical home value: $366,157 in September 2026. This is an estimate of what a typical home is worth, covering homes that did not sell as well as those that did [1][2].
- Median existing home sale price: $417,500 in September 2026, up 1.3% on a year earlier, according to the National Association of Realtors. The median single family home sold for $422,700 and the median condo or co-op for $363,700 [5].
- Median new home sale price: $393,300 in the third quarter of 2026, from the Census Bureau [6].
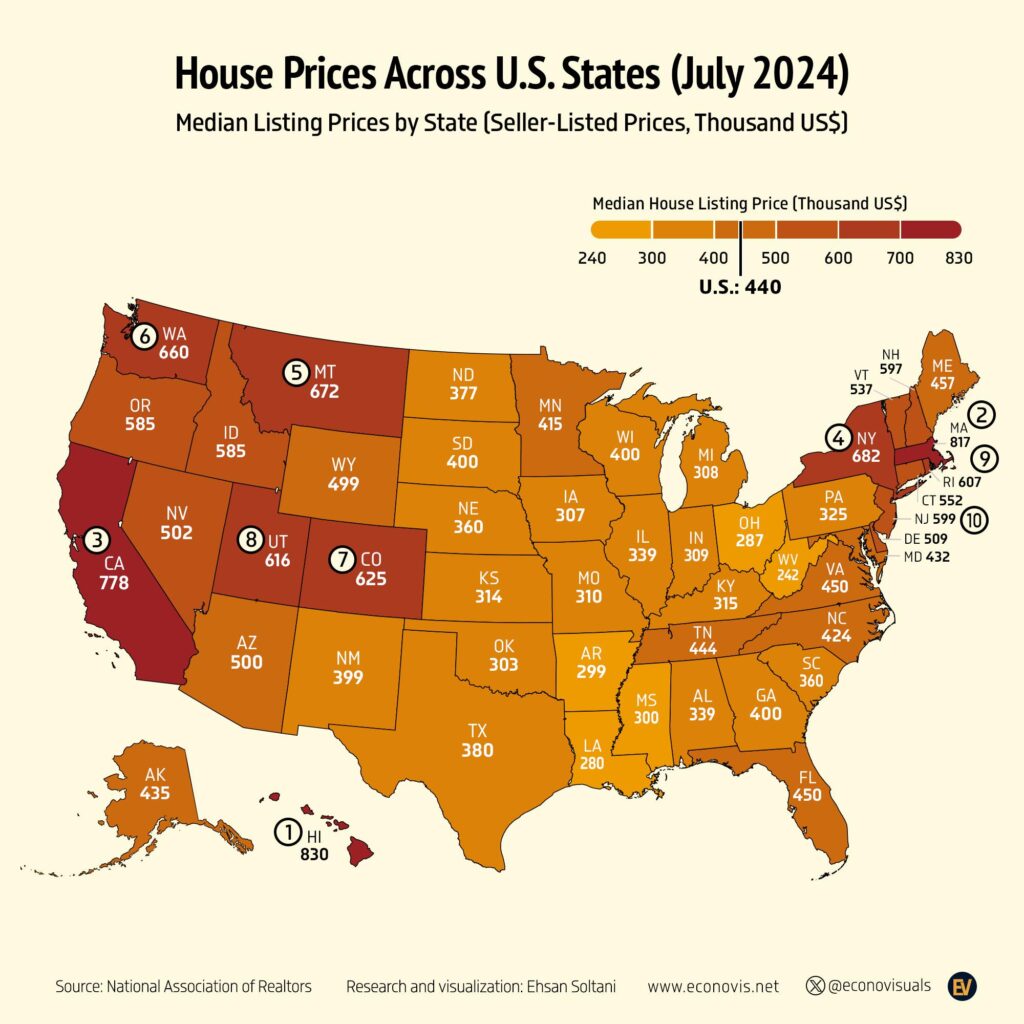
Sale price medians tend to be higher than Zillow’s typical value because the homes that sell in a given month are not a random sample of all homes. Prices also vary hugely by region. NAR’s September 2026 median was $613,600 in the West and $523,600 in the Northeast, against $361,000 in the South and $329,600 in the Midwest [5]. For prices state by state, see our page on median home prices by state.
The housing bubble and the 2008 crash
Prices rose quickly in the early 2000s. The infographic by Ehsan Soltani of Econovis [8] puts this down to low interest rates, easy credit conditions and high demand, the same causes the US Financial Crisis Inquiry Commission pointed to, along with weak mortgage lending standards [9]. The top of the market peaked first, in September 2006, and the rest followed in spring 2007 [1].
When the bubble burst, the most expensive homes fell furthest. From peak to the low point in early 2012, Zillow’s figures show a fall of about 27% for the top tier, 24% for the mid tier and 21% for the bottom tier (our arithmetic) [1]. It then took years to get back. Bottom tier homes passed their old peak in November 2015, typical homes in January 2017 and top tier homes in November 2017. Anyone who bought at the 2006 peak and sold before then would have sold at a loss in cash terms.
Home prices since 2020
The biggest jump in the whole period came after the Covid pandemic began. Mortgage rates fell to a record low of 2.65% in January 2021 [7], which made borrowing cheaper than it had ever been. Between January 2020 and June 2022 typical US home values rose about 39%, with all three tiers rising by a similar amount [1].
The run stopped in 2022 as mortgage rates rose sharply, reaching 7.79% by October 2023 [7]. Zillow’s series shows a small dip from mid 2022 to early 2023, about 2% for the typical home and 4% at the top, before prices started rising again [1]. The Econovis chart labels its last point August 2023, but its end values (about $683,000, $361,000 and $192,000) and the 2022 peak and 2023 dip before them match Zillow’s figures for around August 2024 rather than August 2023, so the chart appears to run a year later than its label says.
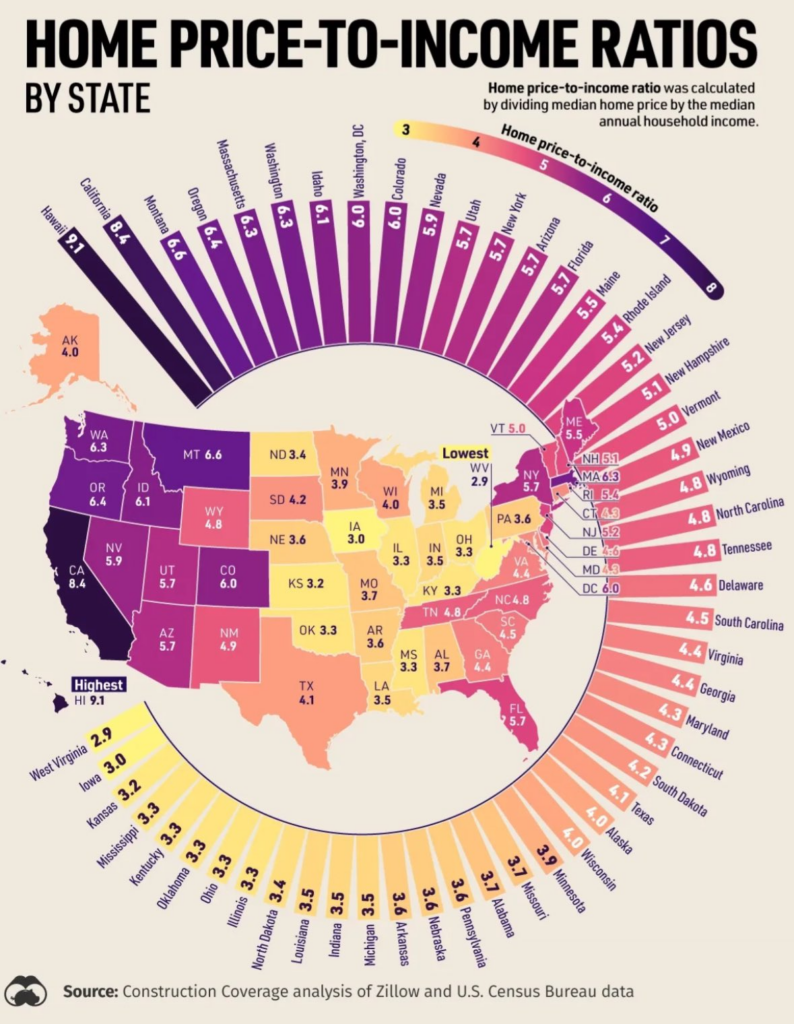
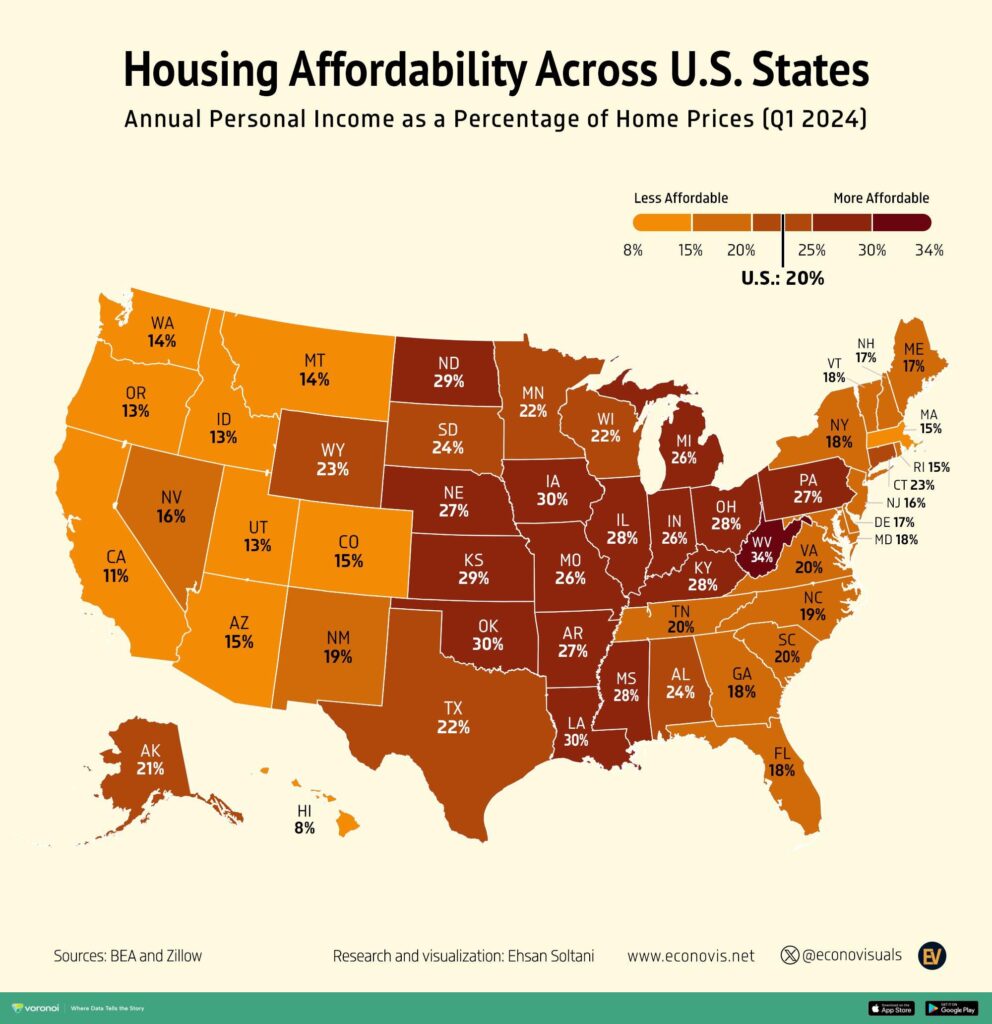
Since then growth has slowed to a crawl. Typical values rose 1.2% in the year to September 2026 on Zillow’s figures [1]. The Federal Housing Finance Agency’s index was up 2.4% in the year to August 2026 [3], and NAR’s median sale price 1.3% in the year to September [5]. With the average 30-year fixed mortgage rate at 7.18% in early November 2026 [7], the main problem for buyers is no longer prices rising fast but the cost of borrowing on top of prices that are already high. Our pages on the house price to income ratio by state and housing affordability by state cover that side in detail.
Cheap and expensive homes have moved differently
Over the whole period, the cheapest homes grew fastest in percentage terms. Bottom tier values are up 3.36 times since January 2000, against 2.90 times for the top tier, and they have also risen most since 2020, about 54% against 43% (our arithmetic) [1].
In dollars, though, the gap has widened a long way. A top tier home was worth about $184,000 more than a bottom tier home in January 2000. By September 2026 the difference was about $509,000. If you own a cheaper home and want to move up the market, you need a much bigger jump in cash than you would have 25 years ago.
What the price tiers mean
Zillow splits homes into tiers by value. The standard Zillow Home Value Index covers homes between the 35th and 65th percentile of values in an area, which is the mid tier. The bottom tier covers the 5th to 35th percentile and the top tier the 65th to 95th, so the very cheapest and very most expensive homes are left out [2]. The figures include single family homes, condos and co-ops.
Zillow’s index is an estimate of value based on its Zestimate model, so it moves more smoothly than sale price medians, which can jump about from month to month depending on what happens to sell. The Case-Shiller and FHFA indexes compare the sale prices of the same homes over time, which removes changes in the mix of homes sold [3][4].
Questions about US home prices
How much have home prices gone up since 2000?
The typical US home value roughly tripled between January 2000 and September 2026, from $122,626 to $366,157 on Zillow’s index [1]. The Case-Shiller national index rose about 3.4 times [4].
What is the average home price in the US right now?
The median existing home sold for $417,500 in September 2026 [5]. Zillow’s typical home value was $366,157 [1], and the median new home sold for $393,300 in the third quarter of 2026 [6].
Are US home prices going down?
Not nationally. Prices were still rising slowly in 2026, by about 1% to 2.5% a year depending on the measure [1][3][5]. Some areas have seen small falls: NAR’s September 2026 figures showed a 0.3% drop in the West [5].
How much did home prices fall in 2008?
Typical US home values fell about 24% from their peak in April 2007 to the low in February 2012 on Zillow’s figures. Top tier homes fell about 27% and bottom tier homes about 21% [1].
Are home prices higher now than in 2006?
Yes, well above. The typical US home is worth about 75% more than at the 2007 peak in cash terms, $366,157 against $209,819 [1].
Sources
- Zillow Research, Housing Data, ZHVI bottom, mid and top tier files for the United States (smoothed, seasonally adjusted, data to September 2026).
- Zillow Research, ZHVI User Guide.
- Federal Housing Finance Agency, FHFA House Price Index up 0.3 percent in August; up 2.4 percent from last year, 27 October 2026.
- S&P Dow Jones Indices via FRED, S&P Cotality Case-Shiller U.S. National Home Price Index.
- National Association of Realtors, Existing-Home Sales Increased 1.5% in September, 13 October 2026.
- US Census Bureau and HUD via FRED, Median Sales Price of New Houses Sold for the United States.
- Freddie Mac via FRED, 30-Year Fixed Rate Mortgage Average in the United States.
- Econovis (Ehsan Soltani), econovis.net. The creator’s site.
- Financial Crisis Inquiry Commission, The Financial Crisis Inquiry Report, January 2011.
Last reviewed 8 November 2026