Key figures from the chart
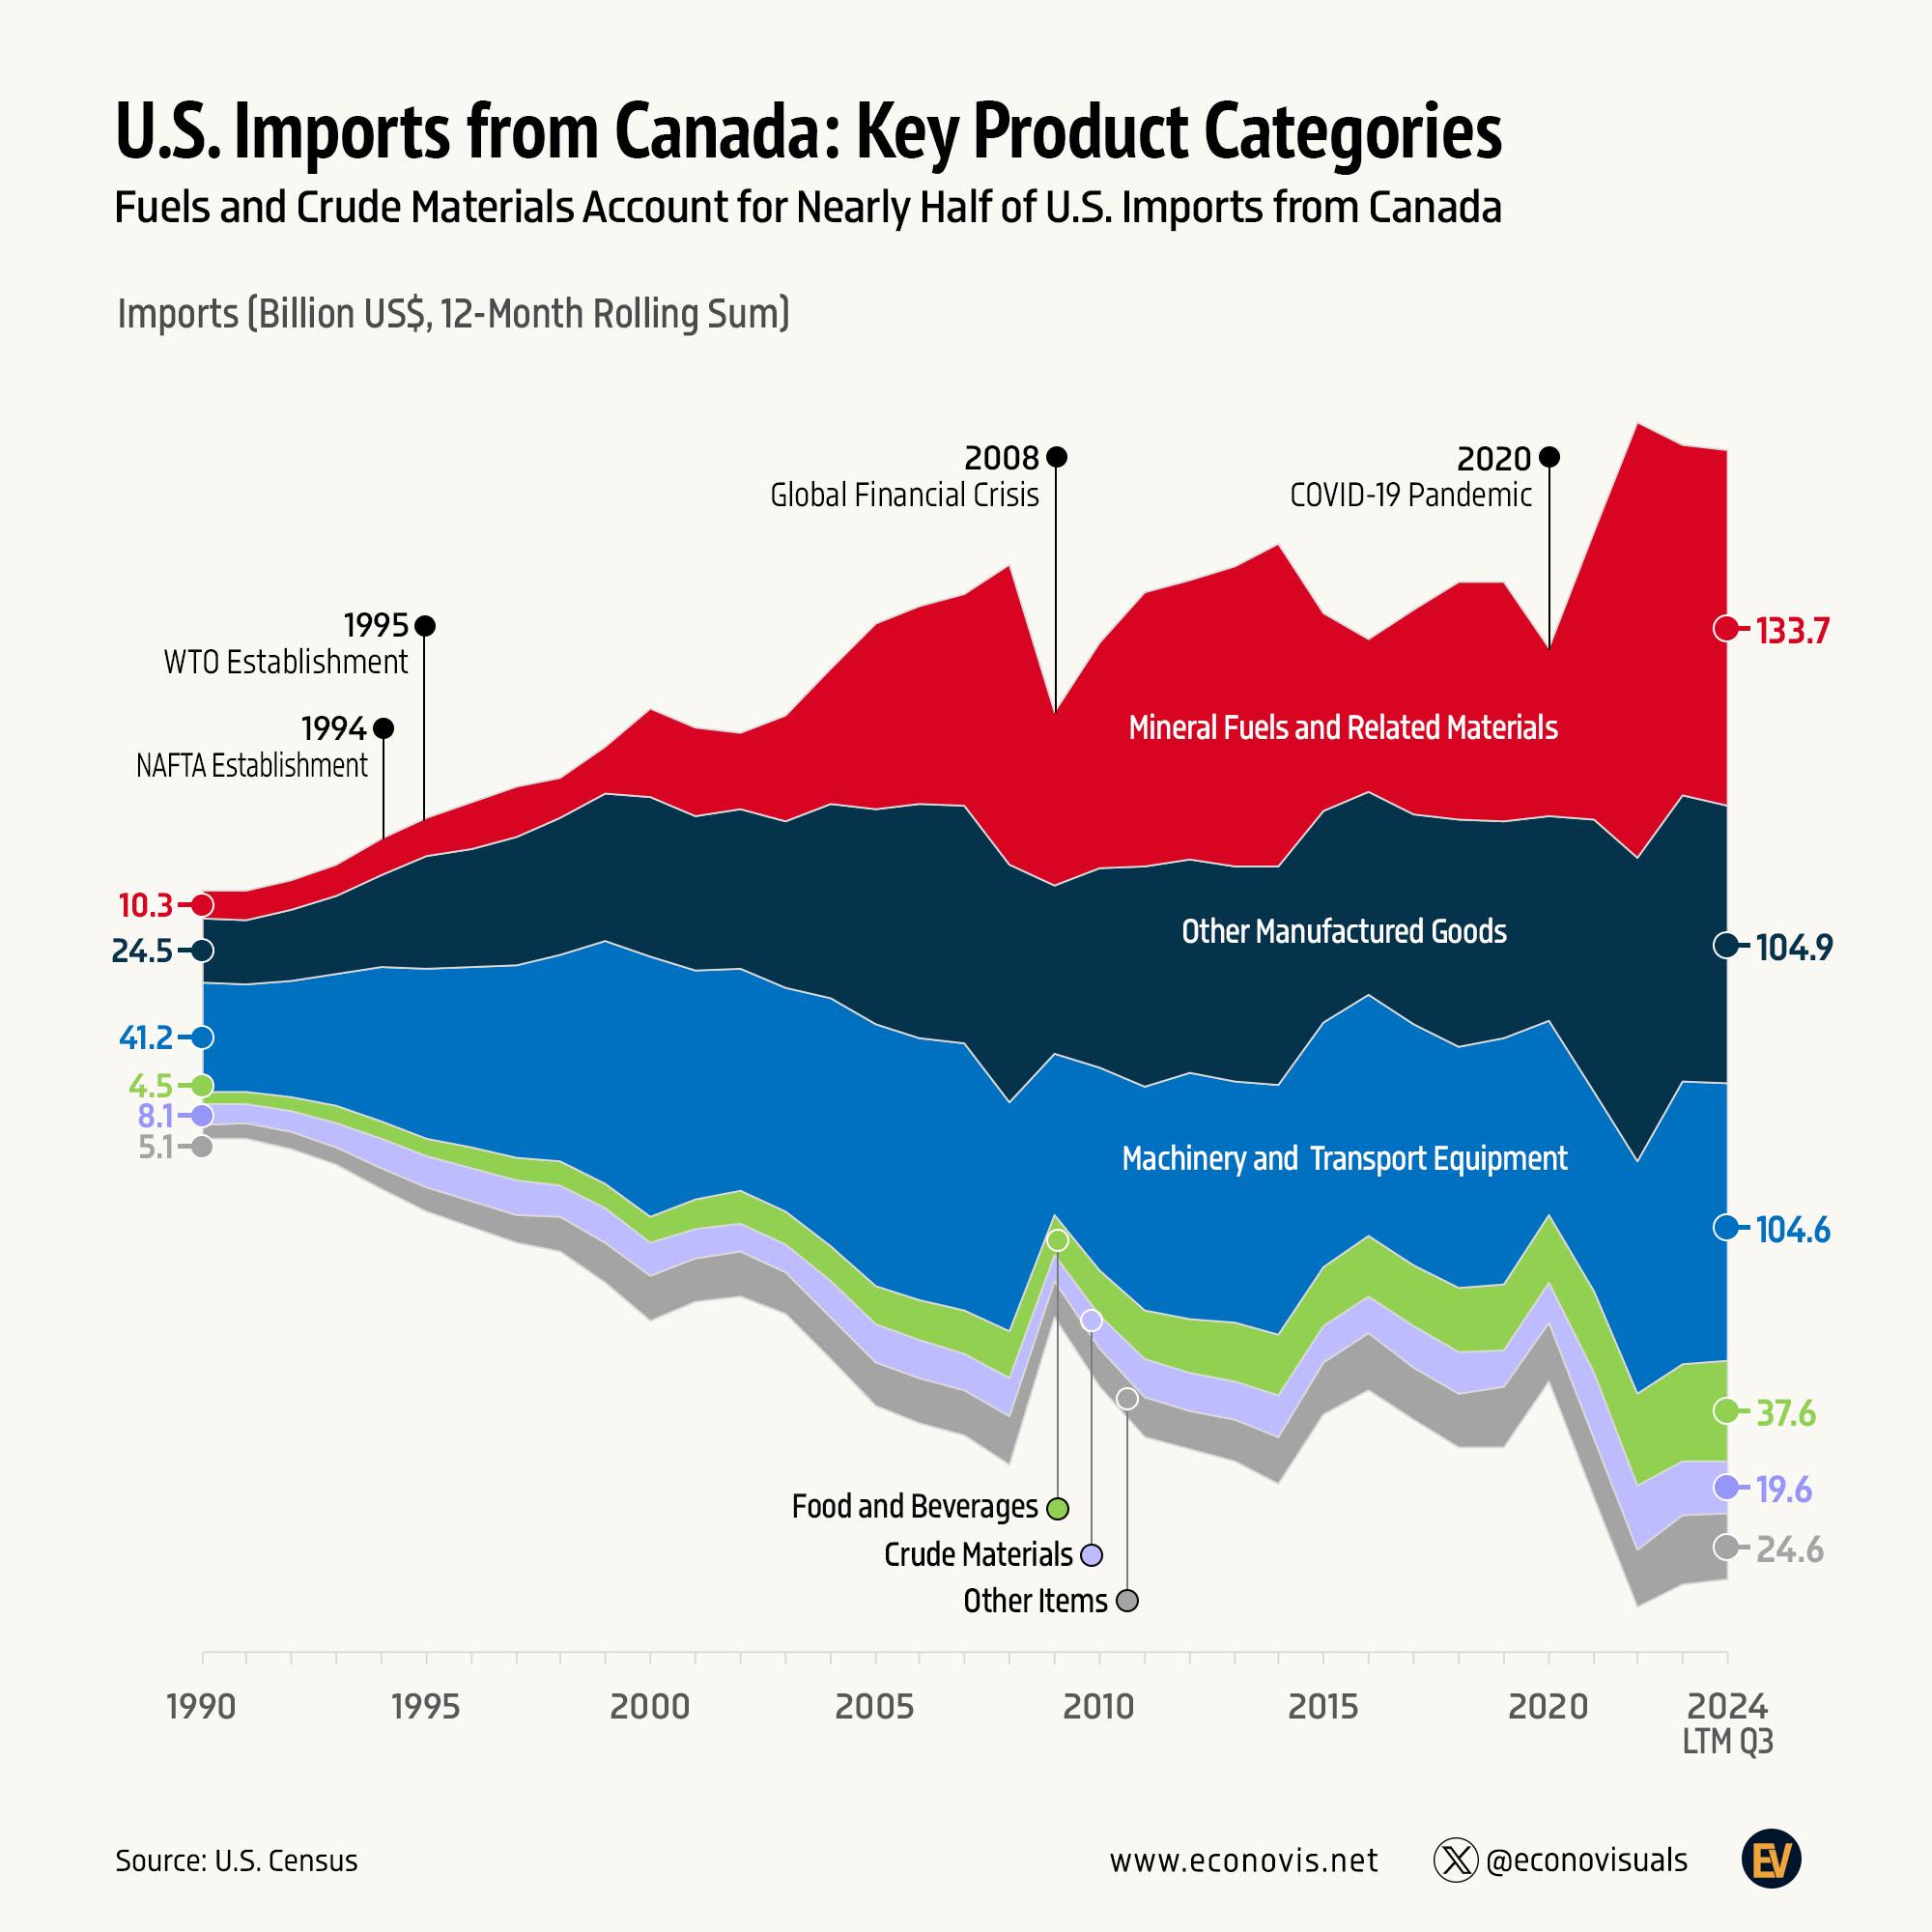
- US imports from Canada came to about $425 billion in the 12 months to September 2024, by our sum of the six categories.
- Mineral fuels and related materials were the largest category at $133.7 billion, up from $10.3 billion in 1990.
- Other manufactured goods ($104.9 billion) and machinery and transport equipment ($104.6 billion) were close behind.
- Machinery and transport equipment was the largest category in 1990 at $41.2 billion.
- All figures are from the graphic, which cites the US Census Bureau.
What the US imports from Canada, category by category
The chart is a stream chart titled “U.S. Imports from Canada: Key Product Categories”, with the subtitle “Fuels and Crude Materials Account for Nearly Half of U.S. Imports from Canada”. Values are in billions of US dollars as a 12 month rolling sum, printed at the start (1990) and the end (2024, last twelve months to the third quarter).
| Category | 1990, billion US$ | 2024 (12 months to Q3), billion US$ | Share of 2024 total (our arithmetic) |
|---|---|---|---|
| Mineral Fuels and Related Materials | 10.3 | 133.7 | 31.5% |
| Other Manufactured Goods | 24.5 | 104.9 | 24.7% |
| Machinery and Transport Equipment | 41.2 | 104.6 | 24.6% |
| Food and Beverages | 4.5 | 37.6 | 8.8% |
| Crude Materials | 8.1 | 19.6 | 4.6% |
| Other Items | 5.1 | 24.6 | 5.8% |
| Total (our sum) | 93.7 | 425.0 | 100% |
The chart marks four events with dots and lines:
| Year marked | Annotation on the chart |
|---|---|
| 1994 | NAFTA Establishment |
| 1995 | WTO Establishment |
| 2008 | Global Financial Crisis |
| 2020 | COVID-19 Pandemic |
The x axis is labelled 1990, 1995, 2000, 2005, 2010, 2015, 2020 and “2024 LTM Q3”. The footer reads “Source: U.S. Census”, with www.econovis.net, @econovisuals and the EV logo. The share column and totals are our own arithmetic from the printed values.
How the mix changed since 1990
In 1990, machinery and transport equipment made up 44% of the categories on the chart and mineral fuels 11%. By 2024 the order had flipped: fuels were the largest category at 31.5% and machinery 24.6% (our arithmetic). The fuels band is also the most uneven on the chart, narrowing after the 2008 marker and again near the 2020 marker.
Econovis gives the same split in the post that carries the chart: fuels $134 billion (31.5%), machinery and transport equipment $105 billion (24.6%), other manufactured goods $105 billion (24.7%), food and beverages $38 billion (8.8%) and crude materials $20 billion (4.6%) [1].
The other direction
Trade runs heavily both ways. In the same 12 months, Econovis puts US exports to Canada at $350 billion, led by machinery and transport equipment at $149 billion (42.7%) and other manufactured goods at $114 billion (32.5%) [2]. The US Trade Representative says Canada was the top destination for US exports in 2024 and the third largest source of US imports [4]. Census Bureau figures put US goods imports from Canada at $411.8 billion for calendar year 2024, against exports of $350.6 billion [3].
Notes on this infographic
- “Nearly half”. The subtitle says fuels and crude materials account for nearly half of US imports from Canada. On the chart’s own figures they come to $153.3 billion of about $425 billion, or about 36% (our arithmetic). Econovis’s own text gives 31.5% and 4.6% for the two categories [1].
- Period. “2024 LTM Q3” means the 12 months ending September 2024 [1]. The Census calendar year 2024 total ($411.8 billion) covers a different 12 months, which is why it differs from the chart [3].
- Totals. The chart prints no total. Totals and shares on this page are our sums.
Questions about US imports from Canada
What does the US import from Canada?
Mostly energy and manufactured goods. In the 12 months to September 2024 the chart shows mineral fuels at $133.7 billion, other manufactured goods at $104.9 billion, machinery and transport equipment at $104.6 billion, food and beverages at $37.6 billion, crude materials at $19.6 billion and other items at $24.6 billion.
What products does Canada import from the USA?
Econovis says machinery and transport equipment ($149 billion) and other manufactured goods ($114 billion) made up about 75% of US exports to Canada in the 12 months to September 2024, followed by food and beverages ($30 billion) and crude materials ($29 billion) [2].
How much did the US import from Canada in 2024?
Census Bureau figures put US goods imports from Canada at $411.8 billion for calendar year 2024, against exports of $350.6 billion [3]. The chart covers a different period, the 12 months to September 2024, and its six categories add up to about $425 billion by our sum. The chart itself prints no total.
What is the largest US import from Canada?
Mineral fuels and related materials, at $133.7 billion in the 12 months to September 2024, up from $10.3 billion in 1990. That is 31.5% of the six categories on the chart (our arithmetic). Machinery and transport equipment was the largest category in 1990 at $41.2 billion, and in 2024 stood at $104.6 billion. The subtitle says fuels and crude materials make up nearly half of imports, but on the chart's own figures they come to about 36%.
Sources
- Econovis, Fuels and Crude Materials Account for Nearly Half of U.S. Imports from Canada, the original post for this chart.
- Econovis, Machinery, Transport Equipment, and Manufactured Goods Make Up 75% of U.S. Exports to Canada.
- U.S. Census Bureau, Trade in Goods with Canada.
- Office of the United States Trade Representative, Canada.
- Econovis, econovis.net, publisher of the chart.
Last reviewed 29 October 2026