Key points from the chart
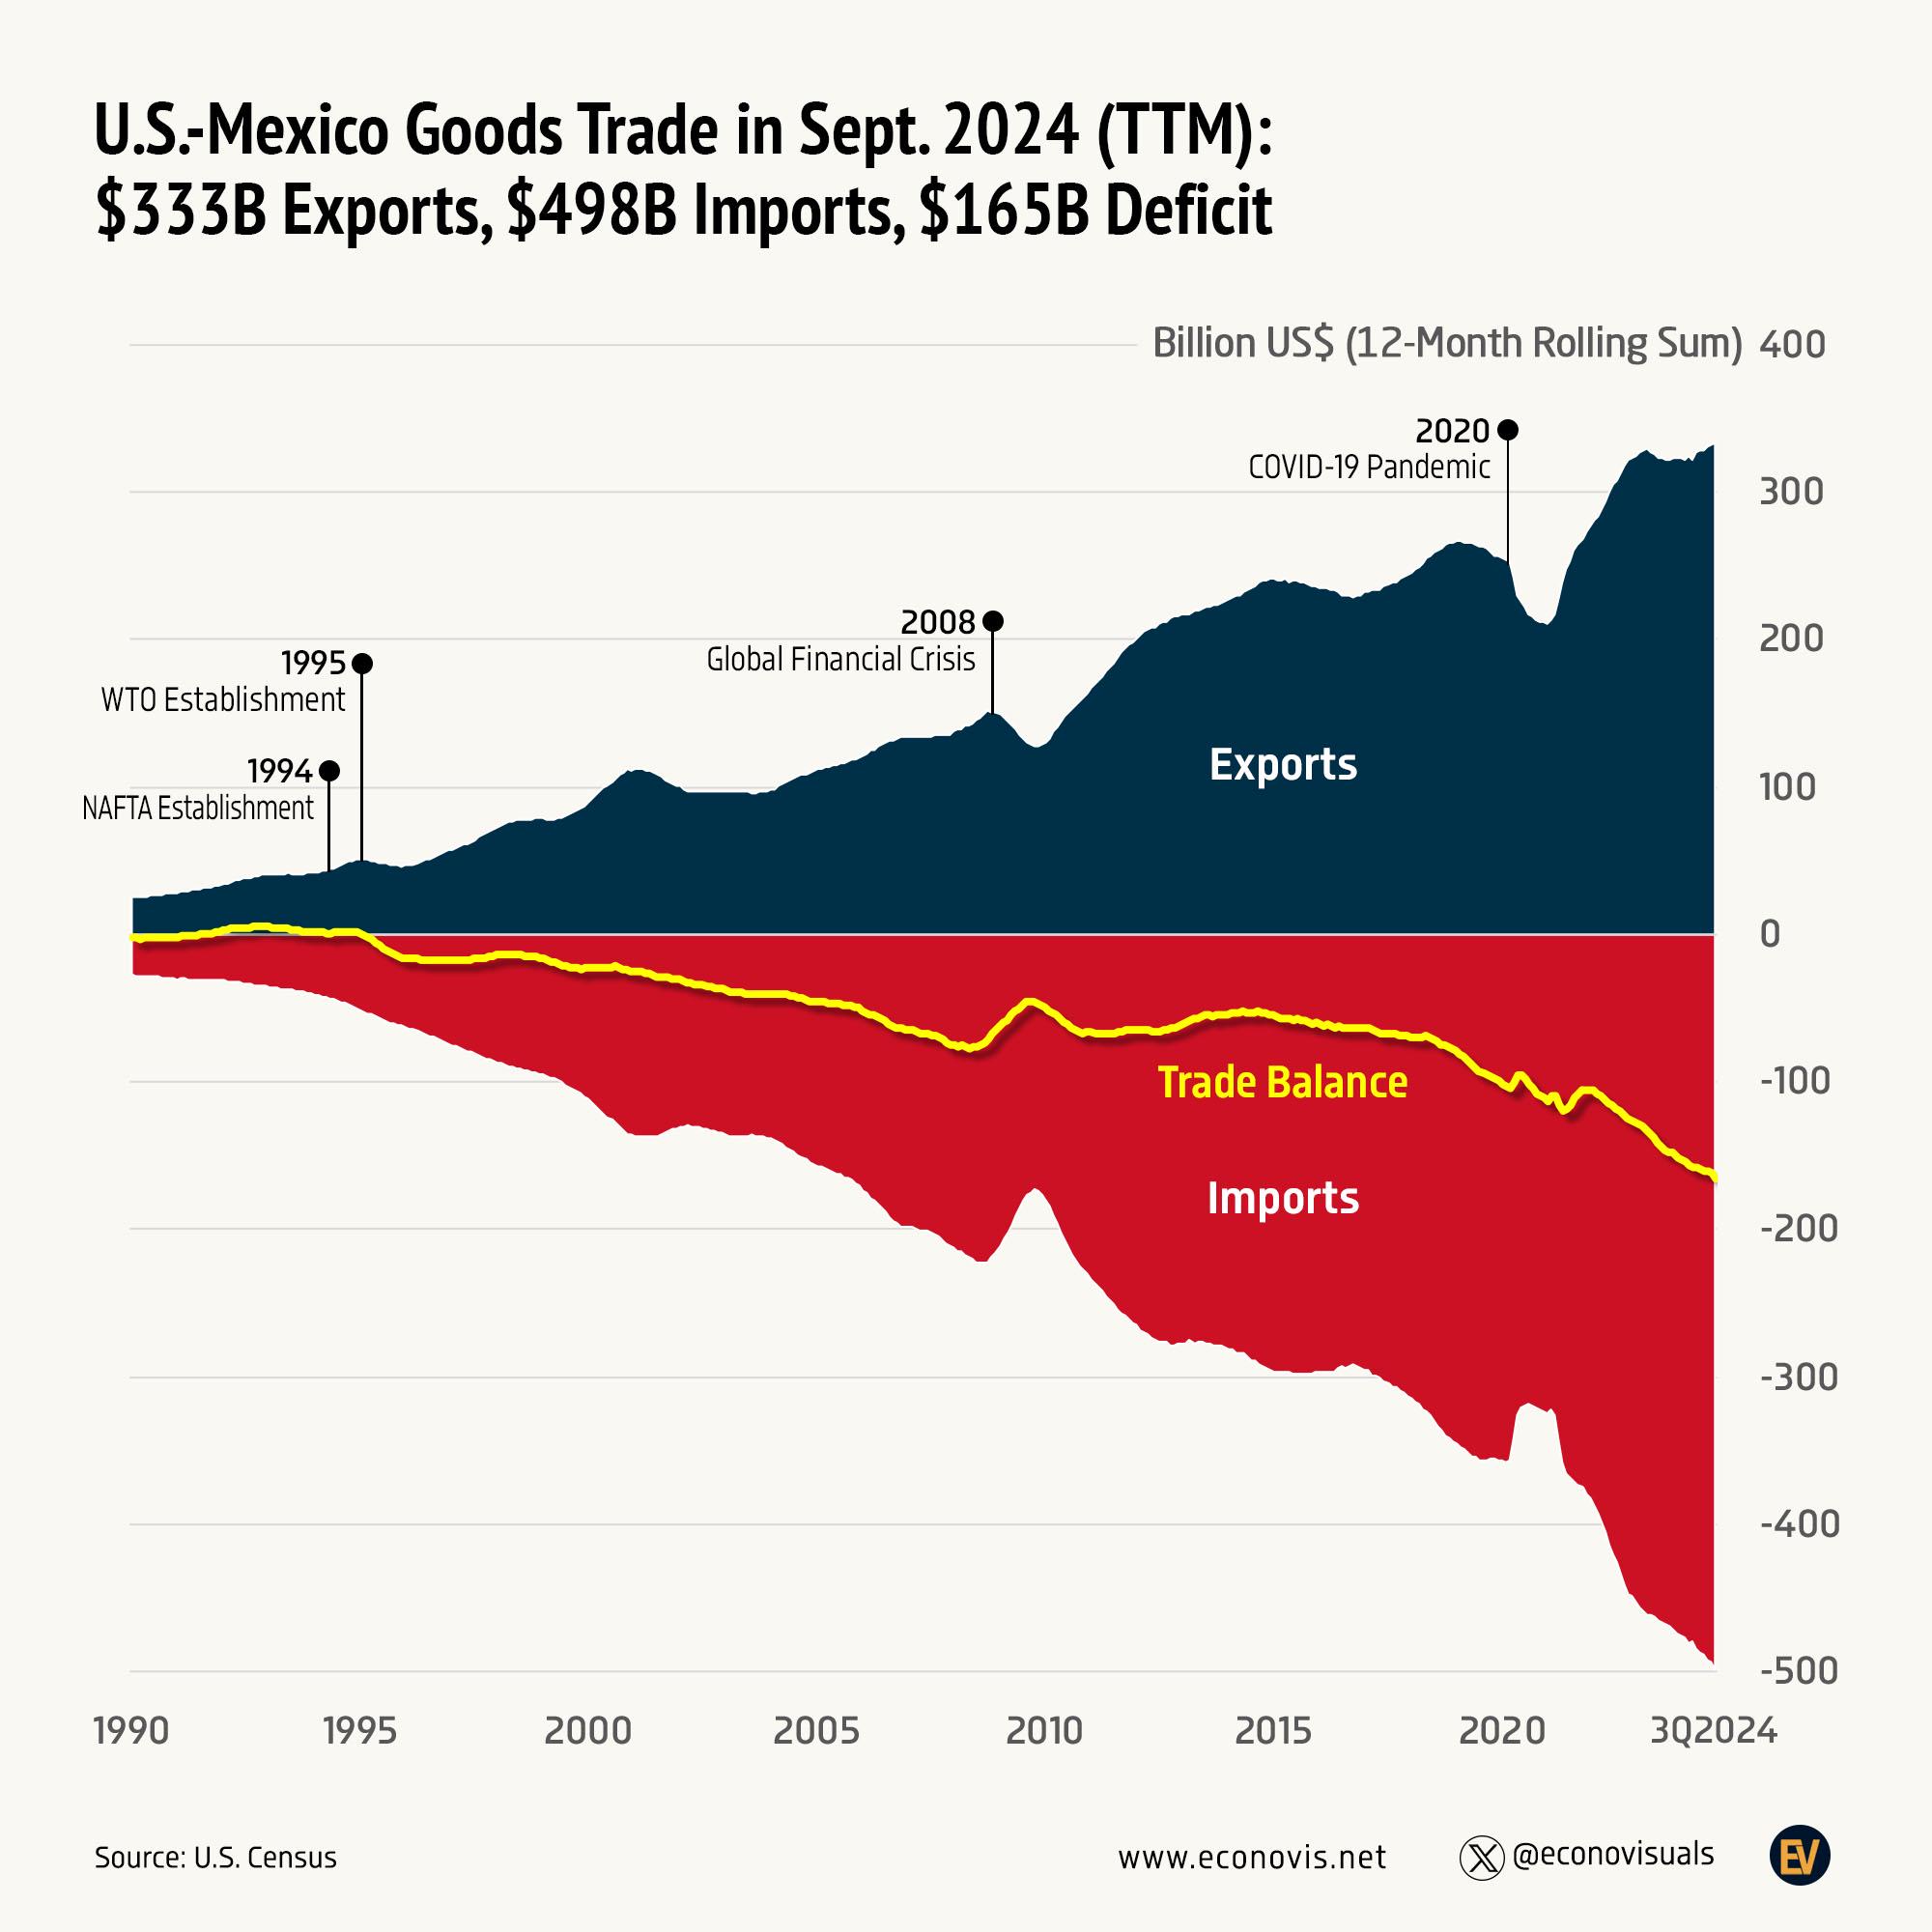
- In the 12 months to September 2024, US goods exports to Mexico were US$333 billion and imports from Mexico were US$498 billion, a US$165 billion deficit.
- Trade in both directions grew more than tenfold from 1990, when each flow was around US$25 to 30 billion.
- The US had a small surplus with Mexico in the early 1990s. The balance turned to deficit after 1995 and widened steeply after 2020.
- The chart marks four events: NAFTA (1994), the WTO (1995), the global financial crisis (2008) and the COVID-19 pandemic (2020). Trade fell after the last two and then recovered to new highs.
The US Mexico trade chart in text
Title: U.S.-Mexico Goods Trade in Sept. 2024 (TTM): $333B Exports, $498B Imports, $165B Deficit. Axis: Billion US$ (12-Month Rolling Sum), from 400 to minus 500. Years: 1990 to 3Q2024. Exports are a dark navy area above zero, imports a red area drawn below zero, and the trade balance a yellow line. Annotations: 1994 NAFTA Establishment, 1995 WTO Establishment, 2008 Global Financial Crisis, 2020 COVID-19 Pandemic. Source: U.S. Census. Footer: www.econovis.net, @econovisuals and the Econovis logo.
The chart prints only the three end values. Read from the shape of the areas, exports rise from about US$25 billion in 1990 to about US$150 billion in 2008, dip in 2009, fall again in 2020 and then climb to US$333 billion. Imports follow the same path at a higher level, reaching US$498 billion. The balance line sits near zero until the mid 1990s, drifts to roughly minus US$75 billion by 2008, recovers briefly in 2009 and then slides to minus US$165 billion.
What US Census data shows
The US Census Bureau’s monthly table of trade in goods with Mexico [2] gives the yearly figures behind the chart. Selected years, in billions of US dollars on a nominal, not seasonally adjusted basis:
| Year | US exports to Mexico (US$ bn) | US imports from Mexico (US$ bn) | Balance (US$ bn) |
|---|---|---|---|
| 1990 | 28.3 | 30.2 | -1.9 |
| 1993 | 41.6 | 39.9 | +1.7 |
| 1994 | 50.8 | 49.5 | +1.3 |
| 1995 | 46.3 | 62.1 | -15.8 |
| 2008 | 151.2 | 215.9 | -64.7 |
| 2009 | 128.9 | 176.7 | -47.8 |
| 2019 | 256.7 | 356.1 | -99.4 |
| 2020 | 212.5 | 323.5 | -111.0 |
| 2023 | 324.4 | 472.9 | -148.5 |
| 2024 | 334.5 | 503.1 | -168.6 |
| 2025 | 337.3 | 534.3 | -197.0 |
Three things stand out. The US ran small surpluses with Mexico in 1993 and 1994 and a deficit of US$15.8 billion in 1995. Both flows fell in 2009 and again in 2020. In 2009 imports fell further than exports, so the deficit narrowed from US$64.7 billion to US$47.8 billion. Since 2020 imports have grown faster than exports, and the deficit rose from US$111.0 billion in 2020 to US$197.0 billion in 2025.
The trend has continued since the chart was made. In the 12 months to August 2026, Census figures add up to US$374.9 billion of exports and US$599.2 billion of imports, a deficit of US$224.3 billion (our sum of the monthly figures) [2].
Notes on this infographic
- Revised figures. Using the Census table as it stands now, the 12 months to September 2024 sum to US$333.8 billion of exports, US$495.6 billion of imports and a US$161.8 billion deficit (our arithmetic) [2]. The chart’s US$498 billion and US$165 billion were the figures published at the time, before Census revisions.
- Goods only. The chart covers trade in goods. It does not include services.
- Imports drawn below zero. The red area is plotted as negative numbers so that exports and imports can share one axis. Imports are not negative values.
- Nominal dollars. The Census figures are not adjusted for inflation, so part of the long-run growth reflects rising prices.
Questions about US Mexico trade
How much does the US export to Mexico?
US goods exports to Mexico were US$334.5 billion in 2024 and US$337.3 billion in 2025, according to the Census Bureau [2]. The chart shows US$333 billion for the 12 months to September 2024.
How much trade is there between the US and Mexico?
Adding exports and imports, US goods trade with Mexico came to about US$838 billion in 2024 and US$872 billion in 2025 (our sums of the Census totals) [2]. In both years US imports from Mexico were larger than exports to it.
What is the US trade deficit with Mexico?
The US goods trade deficit with Mexico was US$197.0 billion in 2025, up from US$168.6 billion in 2024, according to Census Bureau figures [2]. The chart shows a US$165 billion deficit for the 12 months to September 2024. In the 12 months to August 2026 the deficit reached US$224.3 billion (our sum of the monthly figures) [2].
Has the US ever had a trade surplus with Mexico?
Yes, the US ran small goods trade surpluses with Mexico of US$1.7 billion in 1993 and US$1.3 billion in 1994, according to the Census Bureau [2]. In 1995 the balance turned to a deficit of US$15.8 billion. The deficit has widened since, most steeply after 2020, reaching US$197.0 billion in 2025 [2].
Sources
- Econovis, U.S.-Mexico Goods Trade in Sept. 2024 (TTM) (the original chart and note).
- US Census Bureau, Trade in Goods with Mexico (monthly and annual figures, 1985 onwards).
Last reviewed 30 October 2026