US oil and gas production is at an all time high. The United States produced a record 13.66 million barrels of crude oil a day and 39.3 trillion cubic feet of natural gas in 2025, according to the US Energy Information Administration (EIA). That is almost three times the oil it produced in 2008 and nearly double the gas, and shale drilling accounts for most of the increase.
The infographic by Econovis shows how shale took over US oil and gas production between 2000 and 2023, measured in energy content so oil and gas can be compared side by side. This article gives the year by year EIA figures up to 2025, explains what changed and what the EIA expects next.
US oil and gas production by year
US crude oil production has risen in every year since 2009 except 2016 and the pandemic years of 2020 and 2021, and natural gas production has risen in most years too. These are the EIA’s annual figures for crude oil (including lease condensate) and dry natural gas [2] [3].
| Year | Crude oil (thousand barrels per day) | Dry natural gas (trillion cubic feet) |
|---|---|---|
| 2000 | 5,822 | 19.18 |
| 2005 | 5,184 | 18.05 |
| 2008 | 5,000 | 20.16 |
| 2010 | 5,484 | 21.32 |
| 2012 | 6,524 | 24.03 |
| 2014 | 8,781 | 25.89 |
| 2015 | 9,433 | 27.07 |
| 2016 | 8,859 | 26.59 |
| 2018 | 10,972 | 30.77 |
| 2019 | 12,335 | 33.90 |
| 2020 | 11,349 | 33.81 |
| 2021 | 11,324 | 34.53 |
| 2022 | 12,026 | 36.25 |
| 2023 | 12,972 | 37.65 |
| 2024 | 13,267 | 37.72 |
| 2025 | 13,662 | 39.29 |
Between 2008 and 2025 US crude oil output rose 173%, and dry gas production rose 90% from its 2009 level. In 2025 dry gas production averaged about 107.6 billion cubic feet a day [3].
How the shale revolution changed US production
Shale reversed a decline that had lasted almost 40 years. US crude oil production peaked at 9.6 million barrels a day in 1970 and fell by almost half to 5.0 million in 2008, its lowest level since 1946, while gas production stayed roughly flat [2] [4]. From 2009, producers combined horizontal drilling with hydraulic fracturing to get oil and gas out of tight rock formations that had not been worth drilling before [4].
As the Econovis infographic shows, the effect was dramatic. Measured in energy content, shale gas grew from 1.2 to 30.7 quadrillion British thermal units (Btu) between 2000 and 2023, and shale oil from 0.7 to 17.5. Over the same period conventional gas fell from 19.7 to 8.5 quadrillion Btu and conventional oil from 11.7 to 9.4 [1]. Natural gas plant liquids, such as ethane and propane separated from the gas stream, more than trebled from 2.6 to 8.4 [1].
The graphic says crude oil production rose 159% from 2008 to 2023, which matches the EIA’s annual figures (5,000 to 12,972 thousand barrels a day). It gives the rise in natural gas production from 2009 to 2023 as 88%. On the EIA’s dry gas series the rise is about 83% (20.6 to 37.7 trillion cubic feet), so the graphic’s figure is a little high, probably because it uses a different gas measure [1] [3].
How much US oil and gas comes from shale
Most of it. The EIA estimates that about 78% of US dry natural gas production in 2023, 37.87 trillion cubic feet, came from shale formations [5]. For oil, about 8.32 million barrels a day, or 64% of US crude production in 2023, came directly from tight oil formations [6]. The Econovis graphic, which works in energy content rather than barrels, puts shale at 65% of oil and 78% of gas in 2023, up from 6% of each in 2000 [1].
The graphic shows shale overtaking conventional production around 2012 for gas and around 2015 for oil [1]. In 2000 conventional wells supplied 94% of both.
Where US oil and gas comes from
The Permian Basin of west Texas and south-east New Mexico is now the centre of US production. It produced 6.6 million barrels of crude oil a day in 2025, about 48% of the US total, according to the EIA [7]. Texas on its own produced 5.76 million barrels a day in 2025 and New Mexico 2.2 million [8]. North Dakota’s Bakken and federal waters in the Gulf are the other big oil regions.
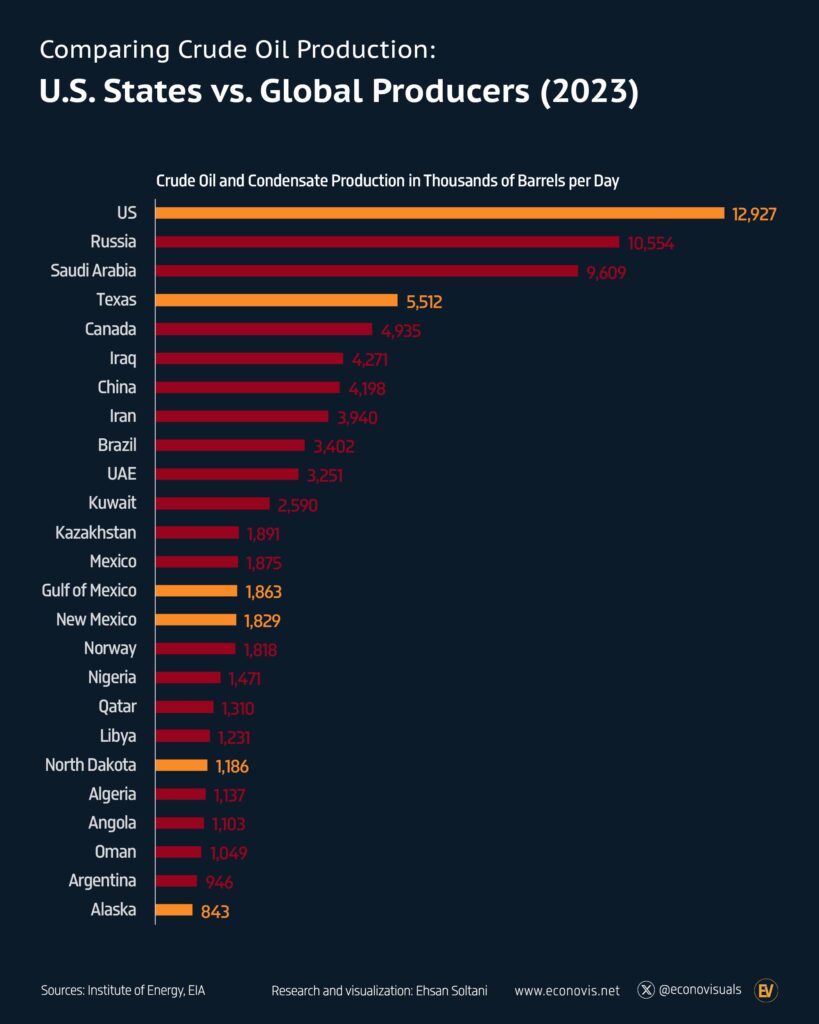
For gas, the Marcellus shale in the Appalachian Basin, spanning Pennsylvania, West Virginia and Ohio, is the largest source of shale gas, according to the EIA. Other big shale gas formations include the Haynesville in east Texas and north Louisiana and the Utica [10]. In the Permian, much of the gas comes up with oil, and the EIA says new pipelines there let producers capture more of this associated gas [11]. Our page on US oil production compared to other countries compares the leading states with whole countries.
Oil prices and production
High oil prices helped pay for the shale boom, but output has kept rising even when prices fell. The graphic notes that oil prices rose by 236% during the energy crisis of 2003 to 2008, and that prices were around $104 to $105 a barrel in 2011 to 2013, when shale oil drilling took off [1]. On the EIA’s annual spot price series, Brent crude averaged $109 to $112 a barrel in those years and the US benchmark WTI $94 to $98, so the graphic’s figure sits between the two [12]. Brent rose from $28.85 in 2003 to $96.94 in 2008, which is where the 236% comes from [12].
Prices then fell sharply in late 2014, and US crude output dipped in 2016 before recovering. The EIA says production kept rising in 2025 even though WTI fell from an average of $77 a barrel in 2024 to $65, because operators keep getting more oil out of each well [7]. The US has been the world’s largest crude oil producer every year since 2018 [7].
US oil and gas trends to watch
The EIA expects US oil output to level off in the short term and then grow again. It forecasts crude oil production staying near 13.7 million barrels a day in 2026 and rising to 14.2 million in 2027 [7]. These forecasts are revised every month in the EIA’s Short-Term Energy Outlook, so check the latest edition for current figures [9].
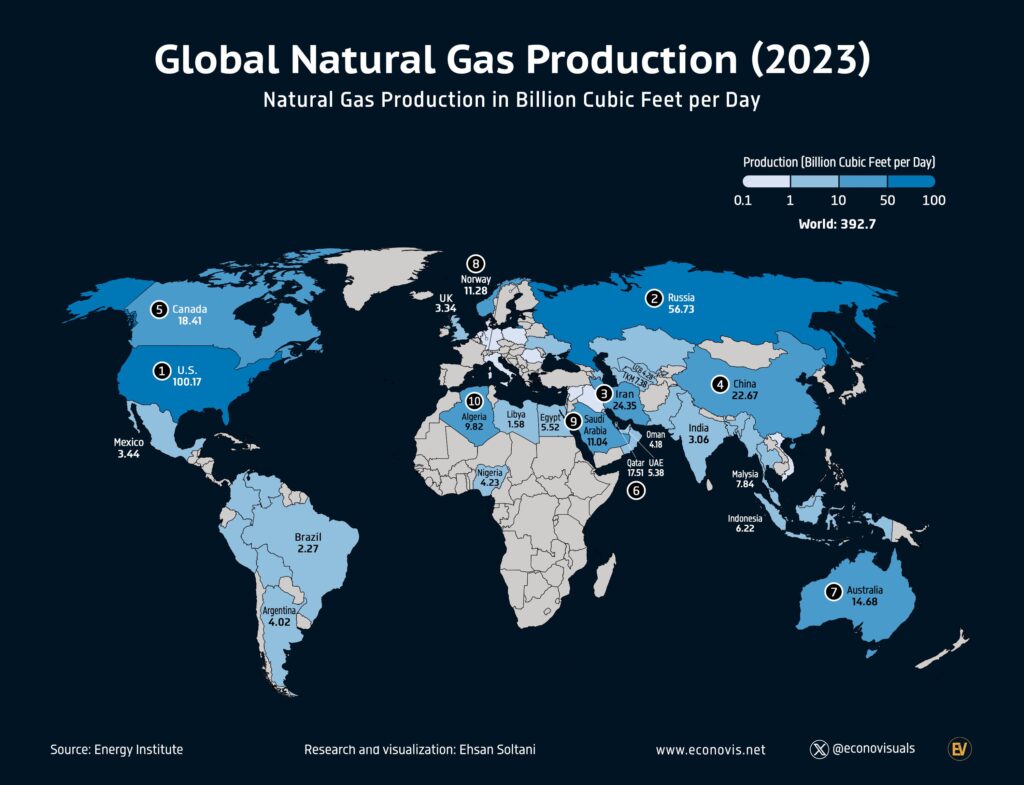
The main things that move the numbers are drilling productivity in the Permian, oil prices, and demand for US gas abroad. The US has been a net exporter of natural gas every year since 2017 and is one of the world’s top exporters of liquefied natural gas (LNG), according to the EIA, so export capacity has become a bigger driver of gas production [11]. For how US oil output compares with the rest of the world, see our page on global crude oil production and on global natural gas production.
Questions about US oil and gas production
Is the US the largest producer of oil and gas?
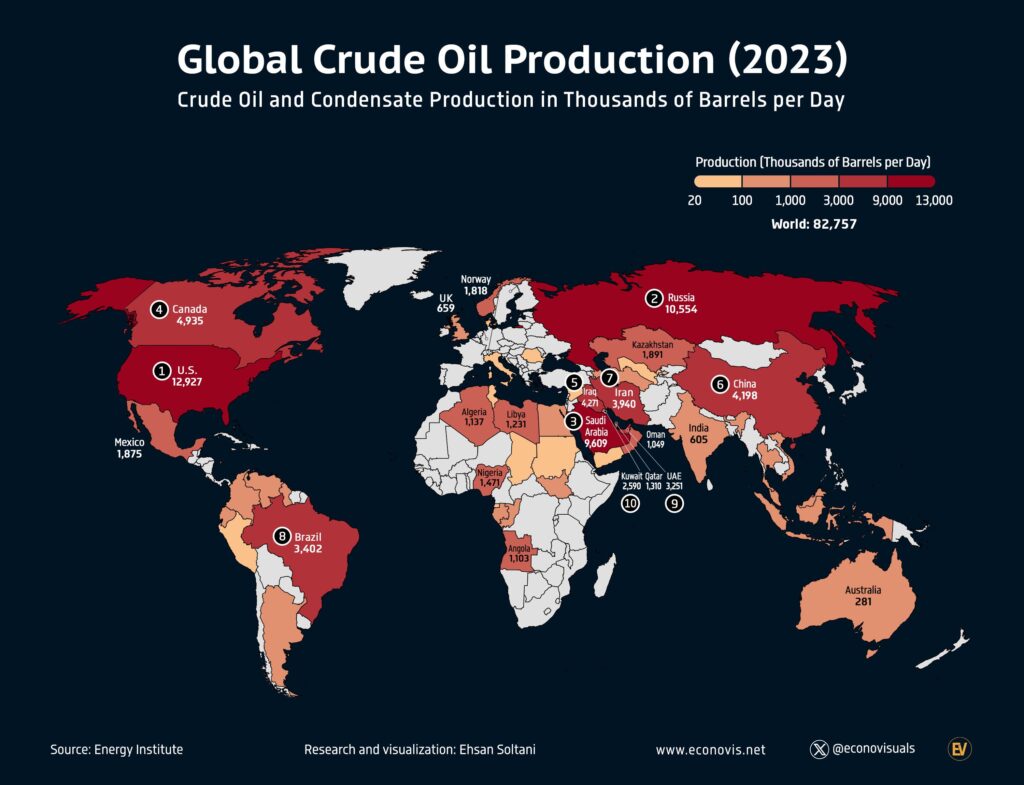
For oil, yes. The US has been the world’s largest crude oil producer every year since 2018, and in 2025 it produced about 40% more crude than Russia or Saudi Arabia, according to the EIA [7]. US dry gas output also set a new record of 39.3 trillion cubic feet in 2025 [3].
Has the US started producing more oil?
Yes. US crude oil production set new records in 2023, 2024 and 2025, reaching 13,662 thousand barrels a day in 2025 according to the EIA’s annual table [2].
How much natural gas does the US produce?
39.3 trillion cubic feet of dry natural gas in 2025, or about 107.6 billion cubic feet a day, the highest on record [3].
Why did US oil production rise after 2008?
Because horizontal drilling and hydraulic fracturing made shale and other tight rock formations economic to produce. Production had fallen from 9.6 million barrels a day in 1970 to 5.0 million in 2008 before the shale boom turned it round [4].
How much of US oil production is shale?
About 64% of US crude oil production in 2023 came directly from tight oil (shale) formations, according to the EIA, and about 78% of dry natural gas came from shale [5] [6].
Sources
- Econovis, The Shale Revolution, Reshaping the U.S. Oil and Gas Industry, by Ehsan Soltani. The creator’s post for this graphic.
- US Energy Information Administration, US field production of crude oil, annual, released 30 October 2026.
- US Energy Information Administration, US natural gas dry production, annual, released 30 October 2026.
- US Energy Information Administration, United States produces more crude oil than any country, ever, 11 March 2024.
- US Energy Information Administration, How much shale gas is produced in the United States?
- US Energy Information Administration, How much shale (tight) oil is produced in the United States?
- US Energy Information Administration, The United States produced more crude oil than any other country in 2025, 9 July 2026.
- US Energy Information Administration, Crude oil production by state, annual.
- US Energy Information Administration, Short-Term Energy Outlook.
- US Energy Information Administration, Where our natural gas comes from.
- US Energy Information Administration, Natural gas imports and exports.
- US Energy Information Administration, Europe Brent spot price, annual and WTI spot price, annual.