Key figures
- Kentucky is the most import dependent state on the map: its imports equal 26% of its GDP.
- Michigan is second at 25%, followed by Tennessee and Illinois at 20% each.
- The national figure, marked on the legend, is 11%.
- The District of Columbia has the lowest share at 1%. Hawaii, South Dakota and Wyoming are at 2%.
- Nine of the ten ranked states are in the Midwest or the South, plus New Jersey in sixth place.
All figures are read from the Econovis map, which names the US Census Bureau and the Bureau of Economic Analysis (BEA) as its sources of primary data.
US state import dependency 2023, in text
Title: U.S. State Import Dependency. Subtitle: Imports as a Percentage of State GDP in 2023. Legend: Imports as a Percentage of GDP, a blue scale with marks at 0%, 5%, 10%, 15%, 20% and 26%, and a marker reading “U.S.: 11%”. Darker blue means a higher share. The ten highest states carry a circled rank number. Every state and the District of Columbia is listed below, highest first.
| State | Imports as a share of state GDP, 2023 | Rank circled on the map |
|---|---|---|
| Kentucky (KY) | 26% | 1 |
| Michigan (MI) | 25% | 2 |
| Illinois (IL) | 20% | 4 |
| Tennessee (TN) | 20% | 3 |
| Indiana (IN) | 18% | 5 |
| New Jersey (NJ) | 18% | 6 |
| South Carolina (SC) | 17% | 7 |
| Georgia (GA) | 16% | 8 |
| Texas (TX) | 15% | 9 |
| Mississippi (MS) | 13% | 10 |
| Rhode Island (RI) | 13% | |
| Alabama (AL) | 12% | |
| California (CA) | 12% | |
| Pennsylvania (PA) | 12% | |
| Delaware (DE) | 11% | |
| Louisiana (LA) | 10% | |
| Montana (MT) | 10% | |
| North Carolina (NC) | 10% | |
| Maryland (MD) | 9% | |
| Ohio (OH) | 9% | |
| Vermont (VT) | 9% | |
| Wisconsin (WI) | 9% | |
| Maine (ME) | 8% | |
| Minnesota (MN) | 8% | |
| Nevada (NV) | 8% | |
| New Hampshire (NH) | 8% | |
| Washington (WA) | 8% | |
| Arizona (AZ) | 7% | |
| Florida (FL) | 7% | |
| New York (NY) | 7% | |
| Oklahoma (OK) | 7% | |
| Utah (UT) | 7% | |
| Connecticut (CT) | 6% | |
| Kansas (KS) | 6% | |
| Massachusetts (MA) | 6% | |
| Missouri (MO) | 6% | |
| North Dakota (ND) | 6% | |
| Oregon (OR) | 6% | |
| Alaska (AK) | 5% | |
| Idaho (ID) | 5% | |
| Iowa (IA) | 5% | |
| Virginia (VA) | 5% | |
| West Virginia (WV) | 5% | |
| Arkansas (AR) | 4% | |
| New Mexico (NM) | 4% | |
| Colorado (CO) | 3% | |
| Nebraska (NE) | 3% | |
| Hawaii (HI) | 2% | |
| South Dakota (SD) | 2% | |
| Wyoming (WY) | 2% | |
| District of Columbia (D.C.) | 1% |
Footer: “Sources of Primary Data: U.S. Census, BEA”, www.econovis.net, @econovisuals and the Econovis EV logo.
Where import dependency is highest
The darkest states form a band from Michigan, Illinois and Indiana in the industrial Midwest down through Kentucky and Tennessee to South Carolina, Georgia and Mississippi. Texas is ninth at 15%, and New Jersey is the only Northeastern state in the ten, sixth at 18%.
Several large states sit close to or below the national figure. California is at 12%, just above the national 11%, and New York and Florida are both at 7%. The lightest states are mostly in the Plains and the Mountain West, such as Colorado and Nebraska at 3%, together with Hawaii and the District of Columbia.
Econovis published the map on 4 January 2025 under its US trade posts, with the subtitle as its only text [1].
How state import figures are measured
The Census Bureau publishes US trade by state in its USA Trade Online database. It offers state exports by “origin of movement” from 2002 and state trade by “state of destination” from 2008, by product and by trading partner [2]. State import figures of this kind describe where imported goods are headed, which is not always where they are finally used or sold, so a state with large distribution hubs or factories that assemble imported parts can show a high share.
The GDP figures in the denominator come from the BEA, as the map’s footer says. The map measures goods imports only against the size of each state’s economy; it does not show which countries the goods come from or what they are.
Notes on this infographic
- Illinois and Tennessee both show 20%, Indiana and New Jersey both show 18%, and Mississippi and Rhode Island both show 13%. Only Mississippi carries a rank (10), so the order between tied states depends on unrounded figures the graphic does not print.
- Econovis does not say on the map whether the import figures are by state of destination. The Census Bureau’s state import series is by state of destination [2], which is the likely basis, but we could not confirm this from the creator’s post.
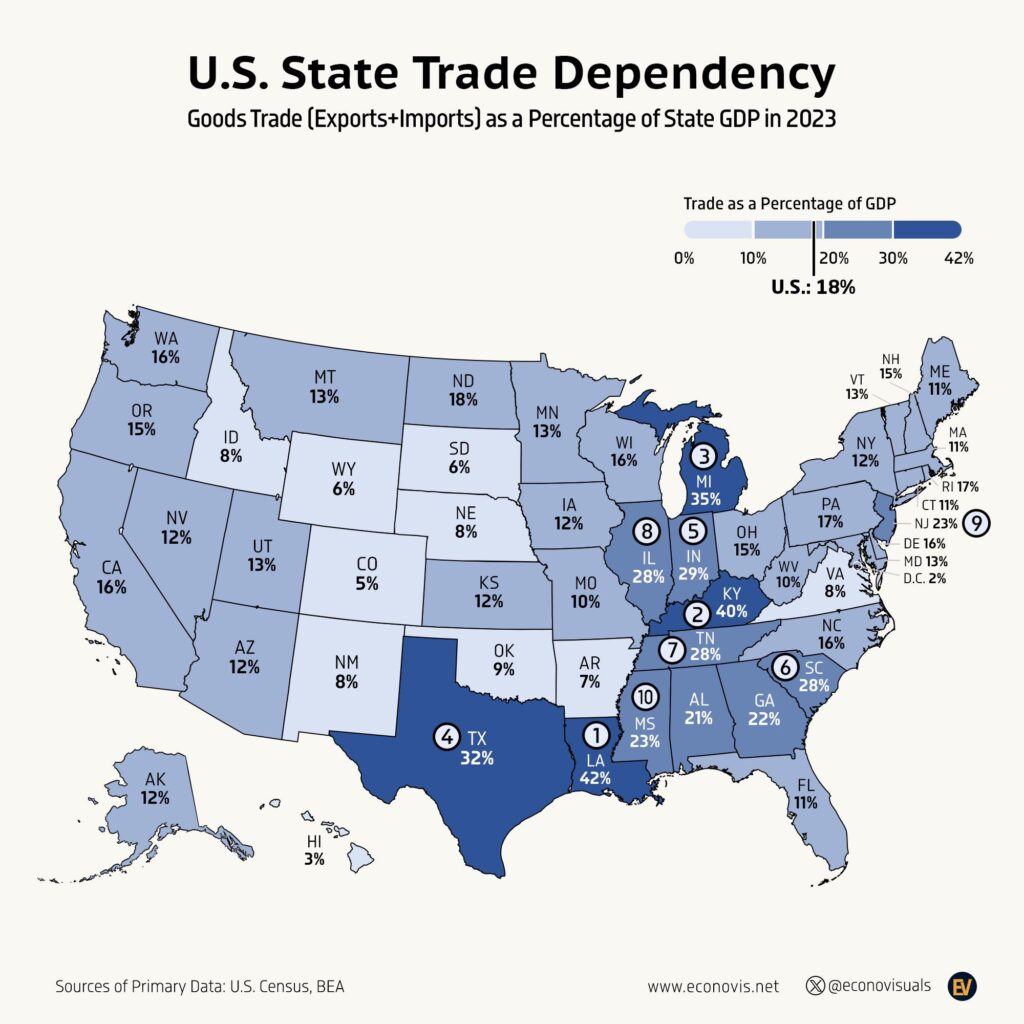
- Econovis made a companion map, U.S. State Trade Dependency, which adds exports to imports. It is a different graphic, not a copy of this one.
Questions about US state import dependency
Which US state is most dependent on imports?
Kentucky is the most import dependent US state, with imports equal to 26% of its GDP in 2023. Michigan is second at 25%, followed by Tennessee and Illinois at 20% each. The national figure is 11%. The figures come from an Econovis map that names the US Census Bureau and the Bureau of Economic Analysis as its sources of primary data.
Which US state imports the least relative to its economy?
The District of Columbia has the lowest share, with imports equal to 1% of its GDP in 2023. Hawaii, South Dakota and Wyoming are next at 2%, and Colorado and Nebraska are at 3%. The lightest states on the map are mostly in the Plains and the Mountain West, together with Hawaii and the District of Columbia.
What share of California's GDP is imports?
Imports were equal to 12% of California's GDP in 2023, just above the national figure of 11%. Other large states sit close to or below that level, with New York and Florida both at 7%. Texas is the large state with the highest share, ninth on the map at 15%, while New Jersey is sixth at 18% and the only Northeastern state in the top ten.
How are state import figures measured?
The US Census Bureau publishes state trade in its USA Trade Online database, with state trade by state of destination from 2008 [2]. These figures describe where imported goods are headed, which is not always where they are finally used or sold, so states with large distribution hubs or factories that assemble imported parts can show a high share. The GDP figures come from the BEA, and the map covers goods imports only.
Sources
- Econovis, U.S. State Import Dependency (4 January 2025), the creator’s post for this map.
- US Census Bureau, State Trade Data, description of state trade series in USA Trade Online.
Last reviewed 30 October 2026